Slovak vs Pueblo Receiving Food Stamps
COMPARE
Slovak
Pueblo
Receiving Food Stamps
Receiving Food Stamps Comparison
Slovaks
Pueblo
10.8%
RECEIVING FOOD STAMPS
89.8/ 100
METRIC RATING
136th/ 347
METRIC RANK
19.9%
RECEIVING FOOD STAMPS
0.0/ 100
METRIC RATING
332nd/ 347
METRIC RANK
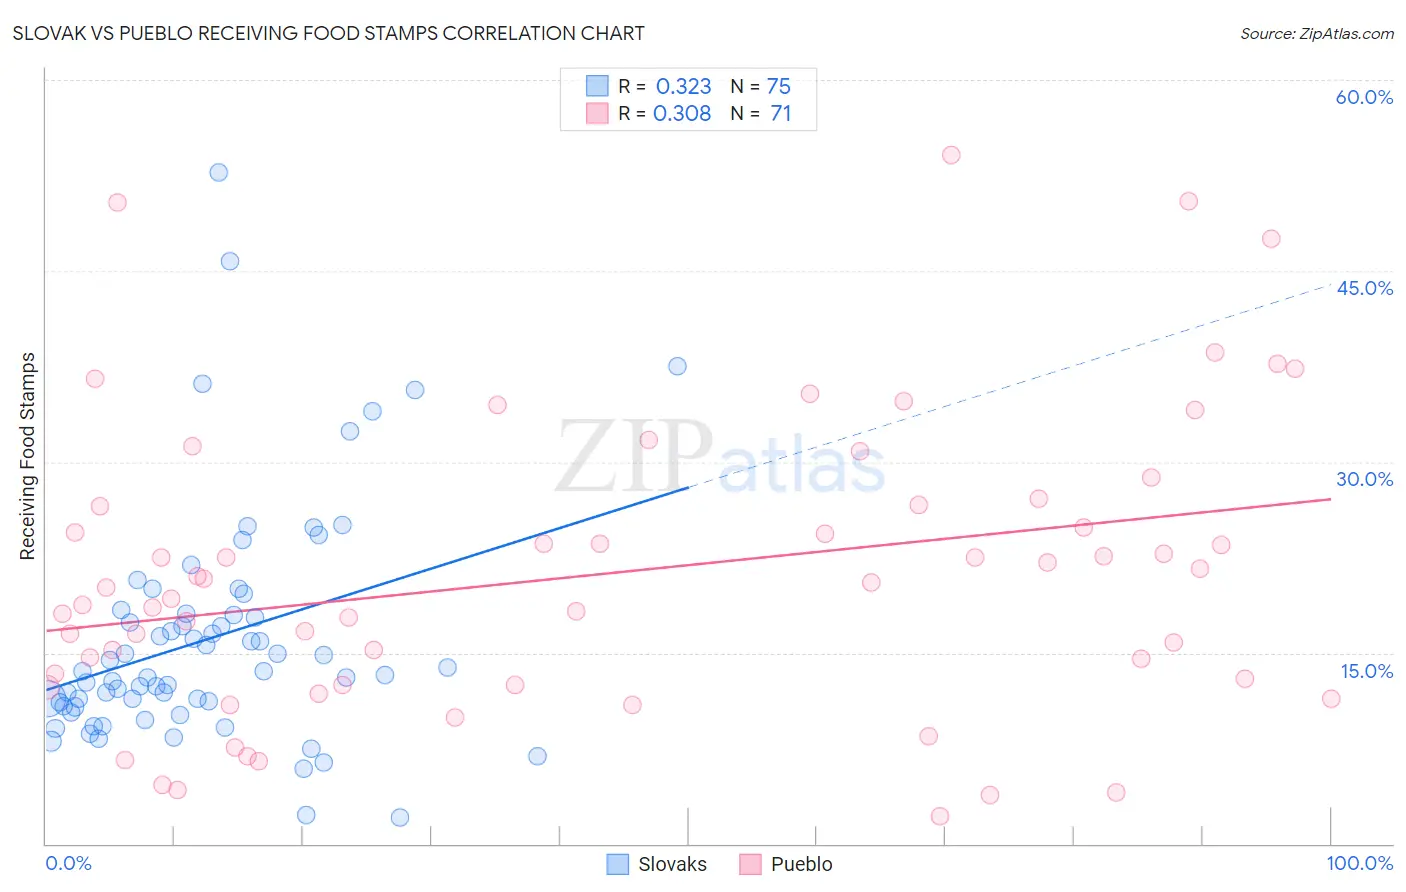
Slovak vs Pueblo Receiving Food Stamps Correlation Chart
The statistical analysis conducted on geographies consisting of 396,487,811 people shows a mild positive correlation between the proportion of Slovaks and percentage of population receiving government assistance and/or food stamps in the United States with a correlation coefficient (R) of 0.323 and weighted average of 10.8%. Similarly, the statistical analysis conducted on geographies consisting of 120,026,955 people shows a mild positive correlation between the proportion of Pueblo and percentage of population receiving government assistance and/or food stamps in the United States with a correlation coefficient (R) of 0.308 and weighted average of 19.9%, a difference of 83.6%.
Receiving Food Stamps Correlation Summary
| Measurement | Slovak | Pueblo |
| Minimum | 2.1% | 2.2% |
| Maximum | 52.7% | 54.1% |
| Range | 50.6% | 51.9% |
| Mean | 16.1% | 21.2% |
| Median | 13.5% | 20.2% |
| Interquartile 25% (IQ1) | 10.8% | 12.5% |
| Interquartile 75% (IQ3) | 18.0% | 26.6% |
| Interquartile Range (IQR) | 7.2% | 14.1% |
| Standard Deviation (Sample) | 9.1% | 11.7% |
| Standard Deviation (Population) | 9.1% | 11.6% |
Similar Demographics by Receiving Food Stamps
Demographics Similar to Slovaks by Receiving Food Stamps
In terms of receiving food stamps, the demographic groups most similar to Slovaks are Immigrants from Eastern Europe (10.8%, a difference of 0.020%), Argentinean (10.8%, a difference of 0.17%), Immigrants from Brazil (10.8%, a difference of 0.19%), Immigrants from Russia (10.8%, a difference of 0.49%), and Immigrants from Moldova (10.9%, a difference of 0.53%).
| Demographics | Rating | Rank | Receiving Food Stamps |
| Yugoslavians | 92.5 /100 | #129 | Exceptional 10.7% |
| Israelis | 92.4 /100 | #130 | Exceptional 10.7% |
| French | 92.3 /100 | #131 | Exceptional 10.7% |
| Immigrants | Germany | 92.0 /100 | #132 | Exceptional 10.7% |
| Immigrants | Russia | 90.9 /100 | #133 | Exceptional 10.8% |
| Immigrants | Brazil | 90.3 /100 | #134 | Exceptional 10.8% |
| Argentineans | 90.2 /100 | #135 | Exceptional 10.8% |
| Slovaks | 89.8 /100 | #136 | Excellent 10.8% |
| Immigrants | Eastern Europe | 89.8 /100 | #137 | Excellent 10.8% |
| Immigrants | Moldova | 88.5 /100 | #138 | Excellent 10.9% |
| Hmong | 88.4 /100 | #139 | Excellent 10.9% |
| Celtics | 87.8 /100 | #140 | Excellent 10.9% |
| Immigrants | Vietnam | 86.7 /100 | #141 | Excellent 11.0% |
| Chileans | 86.2 /100 | #142 | Excellent 11.0% |
| Immigrants | Northern Africa | 86.0 /100 | #143 | Excellent 11.0% |
Demographics Similar to Pueblo by Receiving Food Stamps
In terms of receiving food stamps, the demographic groups most similar to Pueblo are Inupiat (20.1%, a difference of 0.73%), Immigrants from Caribbean (19.6%, a difference of 1.5%), Yuman (20.2%, a difference of 1.6%), Immigrants from Cuba (20.8%, a difference of 4.6%), and Pima (19.0%, a difference of 5.0%).
| Demographics | Rating | Rank | Receiving Food Stamps |
| Immigrants | Haiti | 0.0 /100 | #325 | Tragic 18.2% |
| Cubans | 0.0 /100 | #326 | Tragic 18.2% |
| Apache | 0.0 /100 | #327 | Tragic 18.3% |
| Colville | 0.0 /100 | #328 | Tragic 18.3% |
| Immigrants | Dominica | 0.0 /100 | #329 | Tragic 18.4% |
| Pima | 0.0 /100 | #330 | Tragic 19.0% |
| Immigrants | Caribbean | 0.0 /100 | #331 | Tragic 19.6% |
| Pueblo | 0.0 /100 | #332 | Tragic 19.9% |
| Inupiat | 0.0 /100 | #333 | Tragic 20.1% |
| Yuman | 0.0 /100 | #334 | Tragic 20.2% |
| Immigrants | Cuba | 0.0 /100 | #335 | Tragic 20.8% |
| Navajo | 0.0 /100 | #336 | Tragic 21.1% |
| Cape Verdeans | 0.0 /100 | #337 | Tragic 21.1% |
| Dominicans | 0.0 /100 | #338 | Tragic 21.4% |
| Yakama | 0.0 /100 | #339 | Tragic 21.4% |