Slovak vs Immigrants from Scotland Single Father Poverty
COMPARE
Slovak
Immigrants from Scotland
Single Father Poverty
Single Father Poverty Comparison
Slovaks
Immigrants from Scotland
19.3%
SINGLE FATHER POVERTY
0.0/ 100
METRIC RATING
319th/ 347
METRIC RANK
16.7%
SINGLE FATHER POVERTY
9.6/ 100
METRIC RATING
215th/ 347
METRIC RANK
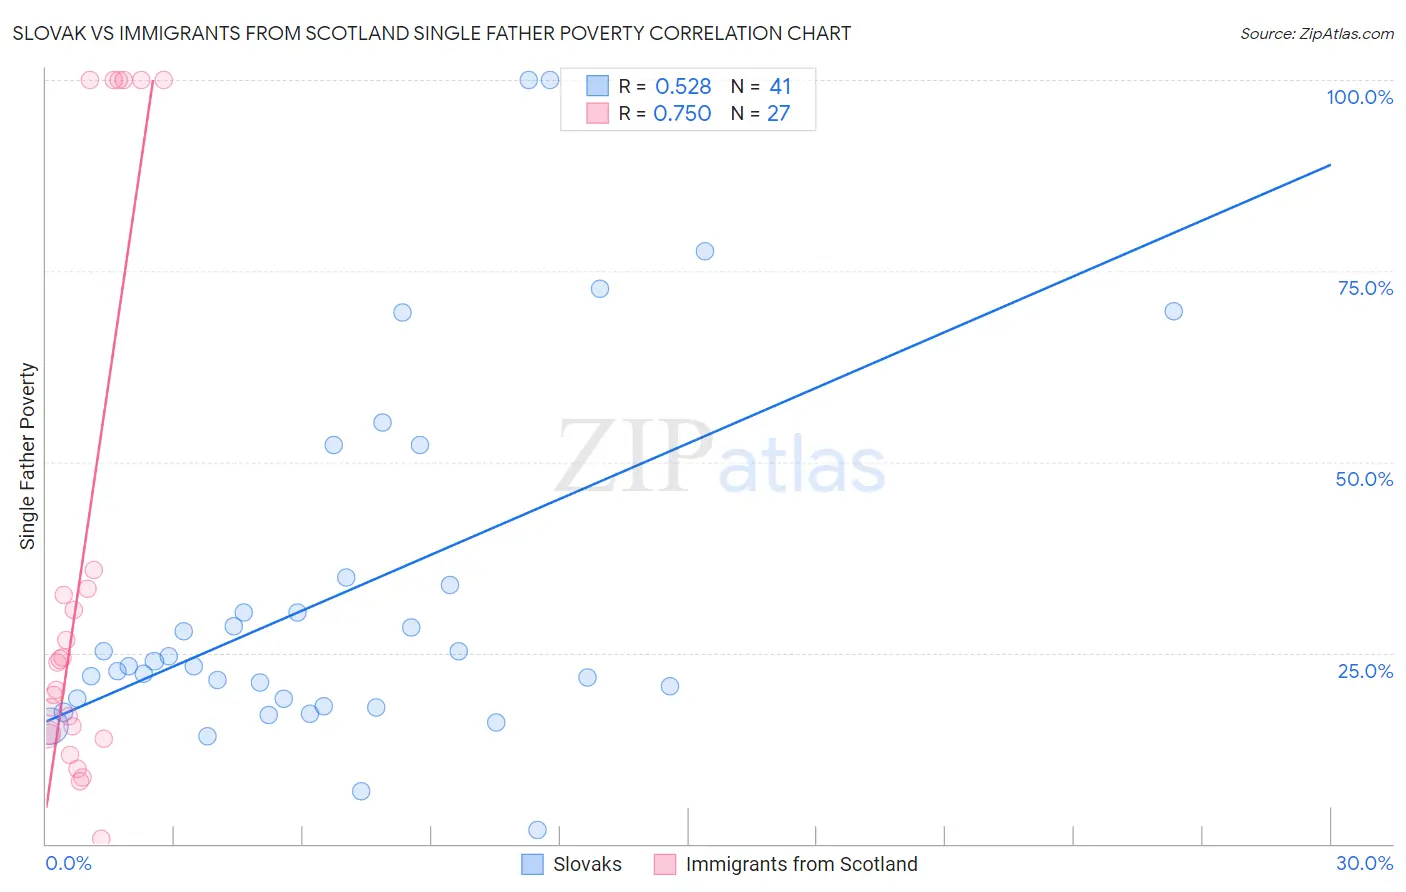
Slovak vs Immigrants from Scotland Single Father Poverty Correlation Chart
The statistical analysis conducted on geographies consisting of 302,741,253 people shows a substantial positive correlation between the proportion of Slovaks and poverty level among single fathers in the United States with a correlation coefficient (R) of 0.528 and weighted average of 19.3%. Similarly, the statistical analysis conducted on geographies consisting of 163,789,782 people shows a strong positive correlation between the proportion of Immigrants from Scotland and poverty level among single fathers in the United States with a correlation coefficient (R) of 0.750 and weighted average of 16.7%, a difference of 15.6%.
Single Father Poverty Correlation Summary
| Measurement | Slovak | Immigrants from Scotland |
| Minimum | 1.8% | 0.70% |
| Maximum | 100.0% | 100.0% |
| Range | 98.2% | 99.3% |
| Mean | 32.6% | 37.1% |
| Median | 23.2% | 23.7% |
| Interquartile 25% (IQ1) | 18.5% | 14.3% |
| Interquartile 75% (IQ3) | 34.3% | 35.9% |
| Interquartile Range (IQR) | 15.8% | 21.6% |
| Standard Deviation (Sample) | 23.5% | 35.2% |
| Standard Deviation (Population) | 23.2% | 34.6% |
Similar Demographics by Single Father Poverty
Demographics Similar to Slovaks by Single Father Poverty
In terms of single father poverty, the demographic groups most similar to Slovaks are Dutch West Indian (19.2%, a difference of 0.52%), Inupiat (19.5%, a difference of 0.91%), Dominican (19.1%, a difference of 1.1%), Osage (19.0%, a difference of 1.4%), and Cherokee (19.6%, a difference of 1.8%).
| Demographics | Rating | Rank | Single Father Poverty |
| Immigrants | Dominica | 0.0 /100 | #312 | Tragic 18.9% |
| Potawatomi | 0.0 /100 | #313 | Tragic 18.9% |
| Delaware | 0.0 /100 | #314 | Tragic 18.9% |
| Chickasaw | 0.0 /100 | #315 | Tragic 19.0% |
| Osage | 0.0 /100 | #316 | Tragic 19.0% |
| Dominicans | 0.0 /100 | #317 | Tragic 19.1% |
| Dutch West Indians | 0.0 /100 | #318 | Tragic 19.2% |
| Slovaks | 0.0 /100 | #319 | Tragic 19.3% |
| Inupiat | 0.0 /100 | #320 | Tragic 19.5% |
| Cherokee | 0.0 /100 | #321 | Tragic 19.6% |
| Creek | 0.0 /100 | #322 | Tragic 19.8% |
| Pennsylvania Germans | 0.0 /100 | #323 | Tragic 20.0% |
| Americans | 0.0 /100 | #324 | Tragic 20.1% |
| Blacks/African Americans | 0.0 /100 | #325 | Tragic 20.4% |
| Immigrants | Yemen | 0.0 /100 | #326 | Tragic 20.6% |
Demographics Similar to Immigrants from Scotland by Single Father Poverty
In terms of single father poverty, the demographic groups most similar to Immigrants from Scotland are Immigrants from England (16.7%, a difference of 0.0%), Cheyenne (16.7%, a difference of 0.030%), Spanish (16.7%, a difference of 0.13%), Immigrants from Uganda (16.7%, a difference of 0.13%), and Ghanaian (16.7%, a difference of 0.17%).
| Demographics | Rating | Rank | Single Father Poverty |
| Eastern Europeans | 13.7 /100 | #208 | Poor 16.6% |
| Europeans | 13.2 /100 | #209 | Poor 16.6% |
| Guatemalans | 12.9 /100 | #210 | Poor 16.6% |
| Arabs | 12.8 /100 | #211 | Poor 16.6% |
| Immigrants | Southern Europe | 11.2 /100 | #212 | Poor 16.7% |
| Ghanaians | 11.0 /100 | #213 | Poor 16.7% |
| Spanish | 10.7 /100 | #214 | Poor 16.7% |
| Immigrants | Scotland | 9.6 /100 | #215 | Tragic 16.7% |
| Immigrants | England | 9.5 /100 | #216 | Tragic 16.7% |
| Cheyenne | 9.3 /100 | #217 | Tragic 16.7% |
| Immigrants | Uganda | 8.6 /100 | #218 | Tragic 16.7% |
| Immigrants | Ghana | 8.1 /100 | #219 | Tragic 16.7% |
| Immigrants | Denmark | 8.1 /100 | #220 | Tragic 16.7% |
| Immigrants | Greece | 8.1 /100 | #221 | Tragic 16.7% |
| Immigrants | Spain | 8.0 /100 | #222 | Tragic 16.7% |