Slovak vs Immigrants from Liberia Poverty
COMPARE
Slovak
Immigrants from Liberia
Poverty
Poverty Comparison
Slovaks
Immigrants from Liberia
11.2%
POVERTY
97.4/ 100
METRIC RATING
68th/ 347
METRIC RANK
14.4%
POVERTY
0.1/ 100
METRIC RATING
262nd/ 347
METRIC RANK
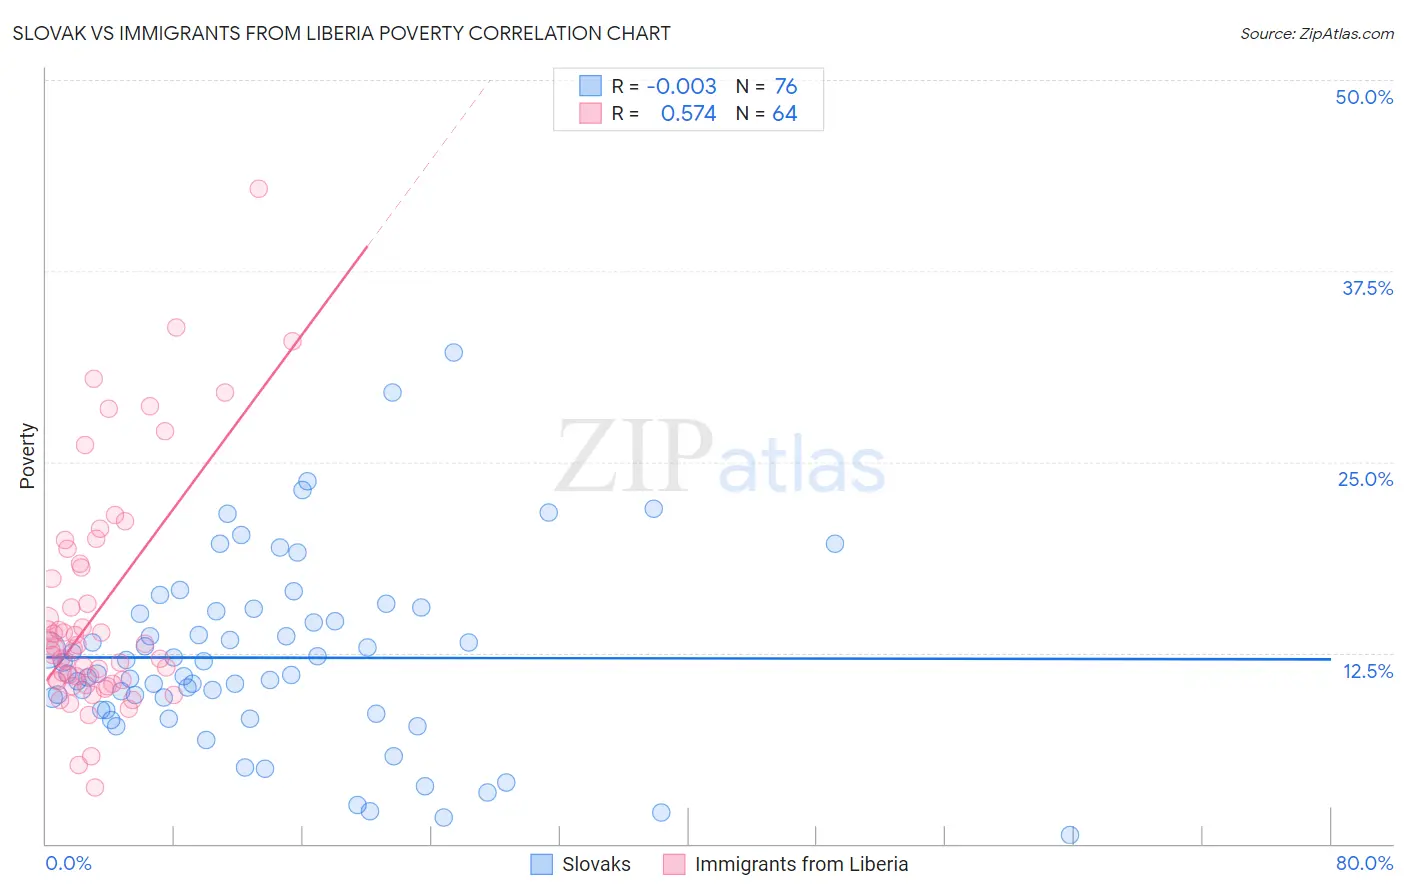
Slovak vs Immigrants from Liberia Poverty Correlation Chart
The statistical analysis conducted on geographies consisting of 397,661,744 people shows no correlation between the proportion of Slovaks and poverty level in the United States with a correlation coefficient (R) of -0.003 and weighted average of 11.2%. Similarly, the statistical analysis conducted on geographies consisting of 135,251,059 people shows a substantial positive correlation between the proportion of Immigrants from Liberia and poverty level in the United States with a correlation coefficient (R) of 0.574 and weighted average of 14.4%, a difference of 28.0%.
Poverty Correlation Summary
| Measurement | Slovak | Immigrants from Liberia |
| Minimum | 0.55% | 3.7% |
| Maximum | 32.2% | 42.9% |
| Range | 31.6% | 39.2% |
| Mean | 12.2% | 15.3% |
| Median | 11.1% | 12.8% |
| Interquartile 25% (IQ1) | 8.8% | 10.7% |
| Interquartile 75% (IQ3) | 15.1% | 18.2% |
| Interquartile Range (IQR) | 6.4% | 7.5% |
| Standard Deviation (Sample) | 6.1% | 7.6% |
| Standard Deviation (Population) | 6.0% | 7.5% |
Similar Demographics by Poverty
Demographics Similar to Slovaks by Poverty
In terms of poverty, the demographic groups most similar to Slovaks are Immigrants from Australia (11.2%, a difference of 0.020%), Immigrants from Netherlands (11.2%, a difference of 0.060%), Serbian (11.2%, a difference of 0.060%), Immigrants from Asia (11.2%, a difference of 0.13%), and Immigrants from Canada (11.3%, a difference of 0.15%).
| Demographics | Rating | Rank | Poverty |
| Immigrants | Italy | 97.9 /100 | #61 | Exceptional 11.2% |
| Austrians | 97.8 /100 | #62 | Exceptional 11.2% |
| Ukrainians | 97.8 /100 | #63 | Exceptional 11.2% |
| Swiss | 97.7 /100 | #64 | Exceptional 11.2% |
| Immigrants | Asia | 97.5 /100 | #65 | Exceptional 11.2% |
| Immigrants | Netherlands | 97.5 /100 | #66 | Exceptional 11.2% |
| Immigrants | Australia | 97.4 /100 | #67 | Exceptional 11.2% |
| Slovaks | 97.4 /100 | #68 | Exceptional 11.2% |
| Serbians | 97.4 /100 | #69 | Exceptional 11.2% |
| Immigrants | Canada | 97.3 /100 | #70 | Exceptional 11.3% |
| Zimbabweans | 97.3 /100 | #71 | Exceptional 11.3% |
| Europeans | 97.2 /100 | #72 | Exceptional 11.3% |
| Immigrants | Belgium | 97.2 /100 | #73 | Exceptional 11.3% |
| Carpatho Rusyns | 97.2 /100 | #74 | Exceptional 11.3% |
| Immigrants | Eastern Europe | 97.0 /100 | #75 | Exceptional 11.3% |
Demographics Similar to Immigrants from Liberia by Poverty
In terms of poverty, the demographic groups most similar to Immigrants from Liberia are Cherokee (14.4%, a difference of 0.16%), Cape Verdean (14.4%, a difference of 0.18%), Immigrants from Nicaragua (14.3%, a difference of 0.26%), Jamaican (14.4%, a difference of 0.35%), and Immigrants from Jamaica (14.4%, a difference of 0.43%).
| Demographics | Rating | Rank | Poverty |
| Immigrants | Ecuador | 0.1 /100 | #255 | Tragic 14.3% |
| Mexican American Indians | 0.1 /100 | #256 | Tragic 14.3% |
| Trinidadians and Tobagonians | 0.1 /100 | #257 | Tragic 14.3% |
| Ottawa | 0.1 /100 | #258 | Tragic 14.3% |
| Immigrants | Nicaragua | 0.1 /100 | #259 | Tragic 14.3% |
| Cape Verdeans | 0.1 /100 | #260 | Tragic 14.4% |
| Cherokee | 0.1 /100 | #261 | Tragic 14.4% |
| Immigrants | Liberia | 0.1 /100 | #262 | Tragic 14.4% |
| Jamaicans | 0.1 /100 | #263 | Tragic 14.4% |
| Immigrants | Jamaica | 0.1 /100 | #264 | Tragic 14.4% |
| Immigrants | Guyana | 0.1 /100 | #265 | Tragic 14.5% |
| Guyanese | 0.1 /100 | #266 | Tragic 14.5% |
| Iroquois | 0.1 /100 | #267 | Tragic 14.5% |
| Sub-Saharan Africans | 0.1 /100 | #268 | Tragic 14.5% |
| Immigrants | Cuba | 0.1 /100 | #269 | Tragic 14.6% |