Slavic vs Paiute Child Poverty Among Boys Under 16
COMPARE
Slavic
Paiute
Child Poverty Among Boys Under 16
Child Poverty Among Boys Under 16 Comparison
Slavs
Paiute
15.7%
CHILD POVERTY AMONG BOYS UNDER 16
84.5/ 100
METRIC RATING
141st/ 347
METRIC RANK
22.8%
CHILD POVERTY AMONG BOYS UNDER 16
0.0/ 100
METRIC RATING
326th/ 347
METRIC RANK
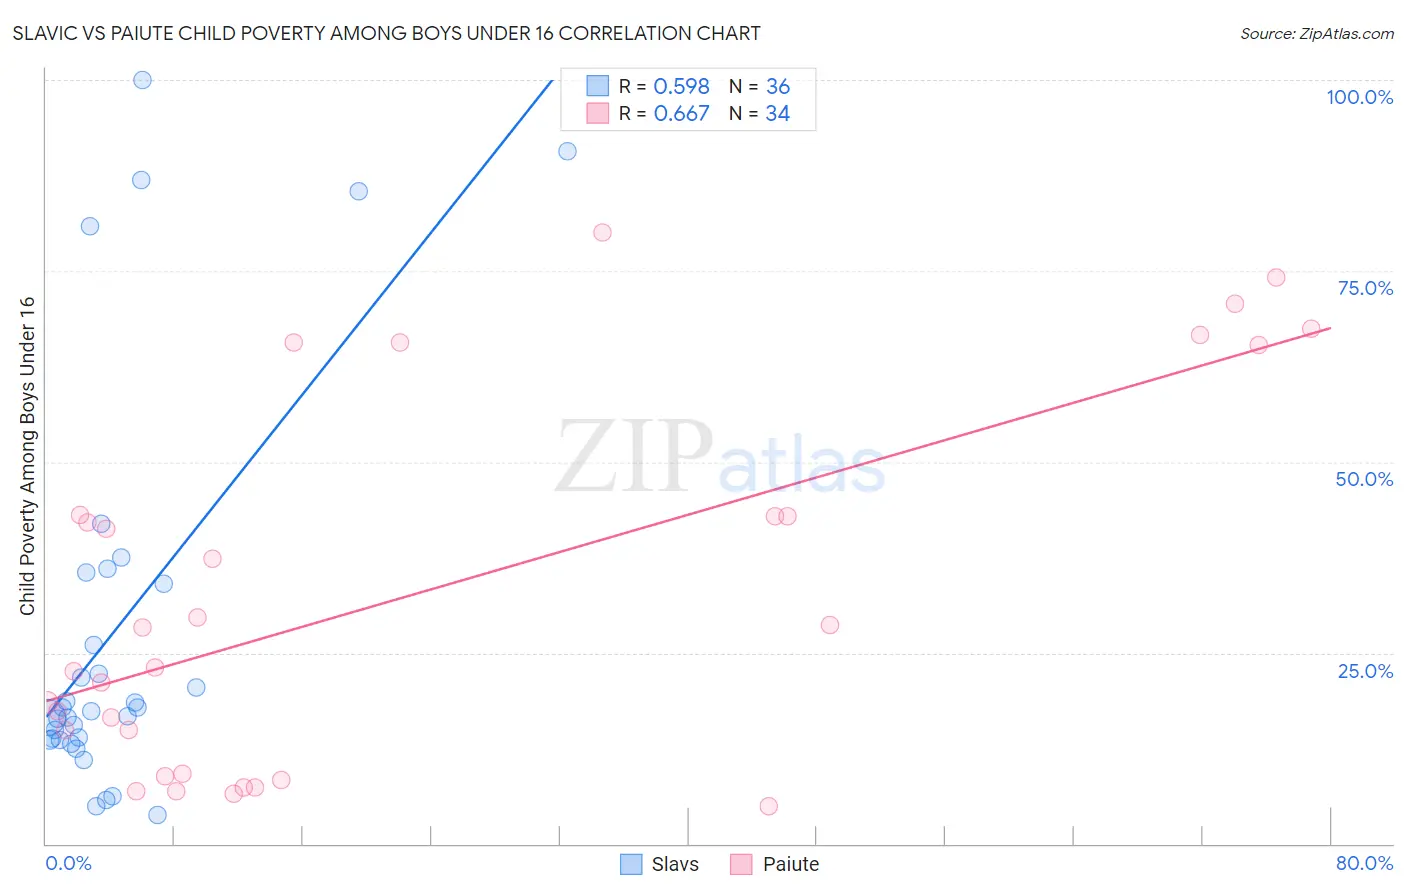
Slavic vs Paiute Child Poverty Among Boys Under 16 Correlation Chart
The statistical analysis conducted on geographies consisting of 267,135,451 people shows a substantial positive correlation between the proportion of Slavs and poverty level among boys under the age of 16 in the United States with a correlation coefficient (R) of 0.598 and weighted average of 15.7%. Similarly, the statistical analysis conducted on geographies consisting of 58,198,272 people shows a significant positive correlation between the proportion of Paiute and poverty level among boys under the age of 16 in the United States with a correlation coefficient (R) of 0.667 and weighted average of 22.8%, a difference of 45.4%.
Child Poverty Among Boys Under 16 Correlation Summary
| Measurement | Slavic | Paiute |
| Minimum | 3.7% | 4.9% |
| Maximum | 100.0% | 80.0% |
| Range | 96.3% | 75.1% |
| Mean | 28.3% | 32.5% |
| Median | 17.6% | 25.7% |
| Interquartile 25% (IQ1) | 13.7% | 9.2% |
| Interquartile 75% (IQ3) | 34.8% | 43.0% |
| Interquartile Range (IQR) | 21.1% | 33.8% |
| Standard Deviation (Sample) | 26.3% | 24.0% |
| Standard Deviation (Population) | 26.0% | 23.6% |
Similar Demographics by Child Poverty Among Boys Under 16
Demographics Similar to Slavs by Child Poverty Among Boys Under 16
In terms of child poverty among boys under 16, the demographic groups most similar to Slavs are Immigrants from Hungary (15.7%, a difference of 0.090%), Immigrants from Fiji (15.7%, a difference of 0.19%), Immigrants from Peru (15.7%, a difference of 0.22%), Immigrants from Kuwait (15.6%, a difference of 0.26%), and Samoan (15.7%, a difference of 0.27%).
| Demographics | Rating | Rank | Child Poverty Among Boys Under 16 |
| Peruvians | 88.1 /100 | #134 | Excellent 15.5% |
| Portuguese | 87.5 /100 | #135 | Excellent 15.5% |
| Icelanders | 87.5 /100 | #136 | Excellent 15.5% |
| Immigrants | Spain | 87.1 /100 | #137 | Excellent 15.6% |
| Immigrants | Southern Europe | 86.5 /100 | #138 | Excellent 15.6% |
| Albanians | 86.5 /100 | #139 | Excellent 15.6% |
| Immigrants | Kuwait | 85.6 /100 | #140 | Excellent 15.6% |
| Slavs | 84.5 /100 | #141 | Excellent 15.7% |
| Immigrants | Hungary | 84.1 /100 | #142 | Excellent 15.7% |
| Immigrants | Fiji | 83.6 /100 | #143 | Excellent 15.7% |
| Immigrants | Peru | 83.5 /100 | #144 | Excellent 15.7% |
| Samoans | 83.2 /100 | #145 | Excellent 15.7% |
| New Zealanders | 82.4 /100 | #146 | Excellent 15.7% |
| Venezuelans | 82.1 /100 | #147 | Excellent 15.7% |
| Brazilians | 81.0 /100 | #148 | Excellent 15.8% |
Demographics Similar to Paiute by Child Poverty Among Boys Under 16
In terms of child poverty among boys under 16, the demographic groups most similar to Paiute are Immigrants from Honduras (22.8%, a difference of 0.12%), Central American Indian (22.5%, a difference of 1.1%), Immigrants from Congo (22.4%, a difference of 1.7%), Honduran (22.3%, a difference of 2.0%), and Immigrants from Dominica (22.2%, a difference of 2.6%).
| Demographics | Rating | Rank | Child Poverty Among Boys Under 16 |
| Dutch West Indians | 0.0 /100 | #319 | Tragic 21.8% |
| U.S. Virgin Islanders | 0.0 /100 | #320 | Tragic 22.0% |
| Cajuns | 0.0 /100 | #321 | Tragic 22.2% |
| Immigrants | Dominica | 0.0 /100 | #322 | Tragic 22.2% |
| Hondurans | 0.0 /100 | #323 | Tragic 22.3% |
| Immigrants | Congo | 0.0 /100 | #324 | Tragic 22.4% |
| Central American Indians | 0.0 /100 | #325 | Tragic 22.5% |
| Paiute | 0.0 /100 | #326 | Tragic 22.8% |
| Immigrants | Honduras | 0.0 /100 | #327 | Tragic 22.8% |
| Pueblo | 0.0 /100 | #328 | Tragic 23.5% |
| Natives/Alaskans | 0.0 /100 | #329 | Tragic 24.0% |
| Colville | 0.0 /100 | #330 | Tragic 24.1% |
| Dominicans | 0.0 /100 | #331 | Tragic 24.2% |
| Immigrants | Dominican Republic | 0.0 /100 | #332 | Tragic 24.3% |
| Apache | 0.0 /100 | #333 | Tragic 24.5% |