Slavic vs Korean Single Father Poverty
COMPARE
Slavic
Korean
Single Father Poverty
Single Father Poverty Comparison
Slavs
Koreans
17.4%
SINGLE FATHER POVERTY
0.3/ 100
METRIC RATING
269th/ 347
METRIC RANK
14.0%
SINGLE FATHER POVERTY
100.0/ 100
METRIC RATING
10th/ 347
METRIC RANK
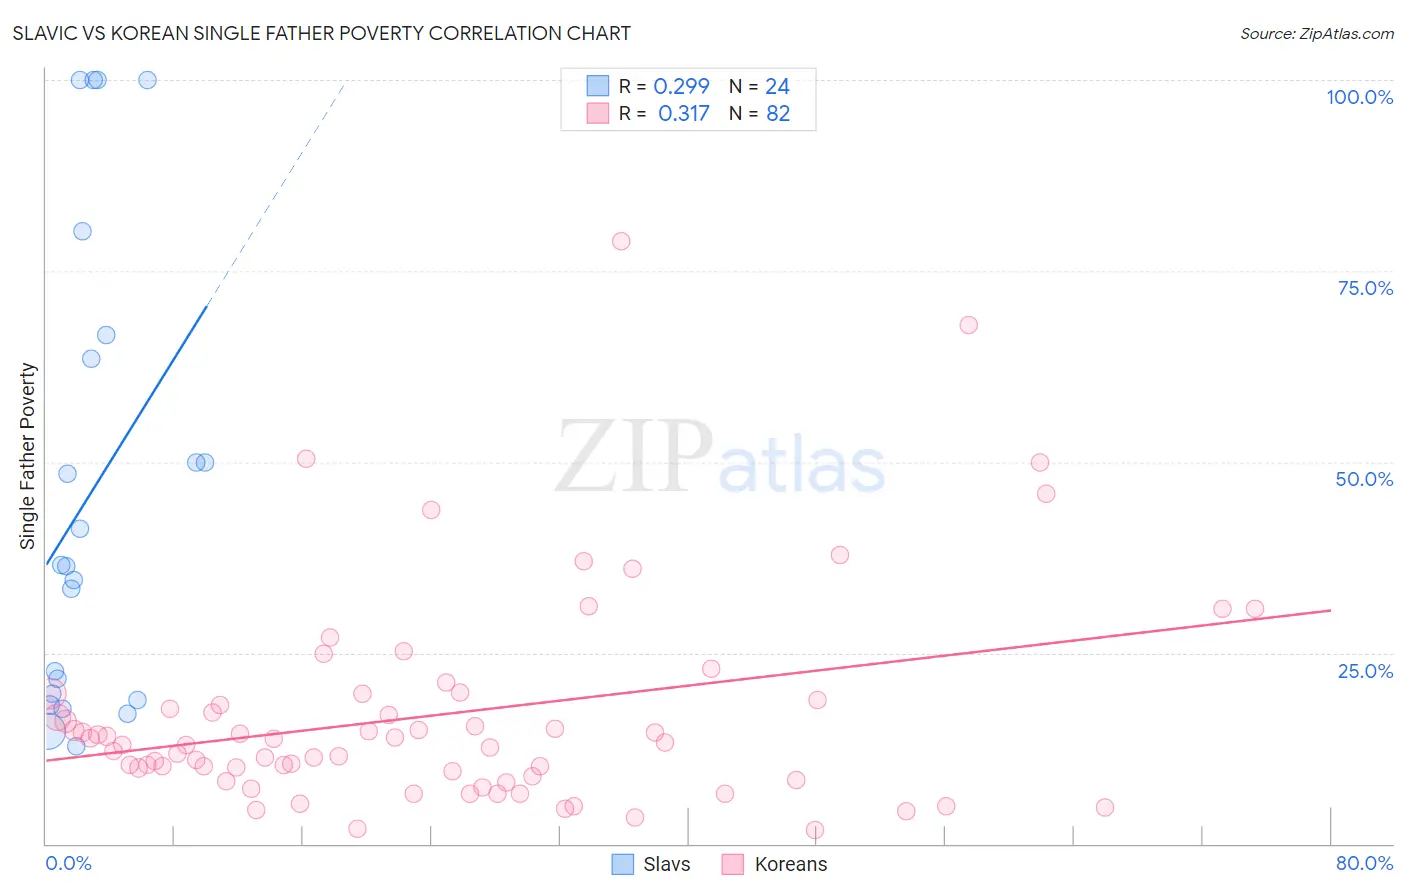
Slavic vs Korean Single Father Poverty Correlation Chart
The statistical analysis conducted on geographies consisting of 218,860,364 people shows a weak positive correlation between the proportion of Slavs and poverty level among single fathers in the United States with a correlation coefficient (R) of 0.299 and weighted average of 17.4%. Similarly, the statistical analysis conducted on geographies consisting of 383,489,954 people shows a mild positive correlation between the proportion of Koreans and poverty level among single fathers in the United States with a correlation coefficient (R) of 0.317 and weighted average of 14.0%, a difference of 24.3%.
Single Father Poverty Correlation Summary
| Measurement | Slavic | Korean |
| Minimum | 12.8% | 1.8% |
| Maximum | 100.0% | 78.9% |
| Range | 87.2% | 77.1% |
| Mean | 46.0% | 16.9% |
| Median | 36.4% | 13.1% |
| Interquartile 25% (IQ1) | 19.2% | 8.8% |
| Interquartile 75% (IQ3) | 65.1% | 18.8% |
| Interquartile Range (IQR) | 45.9% | 9.9% |
| Standard Deviation (Sample) | 30.4% | 14.0% |
| Standard Deviation (Population) | 29.7% | 13.9% |
Similar Demographics by Single Father Poverty
Demographics Similar to Slavs by Single Father Poverty
In terms of single father poverty, the demographic groups most similar to Slavs are Immigrants from Caribbean (17.4%, a difference of 0.070%), Haitian (17.3%, a difference of 0.17%), Jamaican (17.3%, a difference of 0.21%), Polish (17.3%, a difference of 0.26%), and Indonesian (17.4%, a difference of 0.26%).
| Demographics | Rating | Rank | Single Father Poverty |
| Immigrants | Zaire | 0.4 /100 | #262 | Tragic 17.3% |
| Lithuanians | 0.4 /100 | #263 | Tragic 17.3% |
| Slovenes | 0.3 /100 | #264 | Tragic 17.3% |
| Poles | 0.3 /100 | #265 | Tragic 17.3% |
| Jamaicans | 0.3 /100 | #266 | Tragic 17.3% |
| Haitians | 0.3 /100 | #267 | Tragic 17.3% |
| Immigrants | Caribbean | 0.3 /100 | #268 | Tragic 17.4% |
| Slavs | 0.3 /100 | #269 | Tragic 17.4% |
| Indonesians | 0.2 /100 | #270 | Tragic 17.4% |
| French American Indians | 0.2 /100 | #271 | Tragic 17.4% |
| Barbadians | 0.1 /100 | #272 | Tragic 17.5% |
| Italians | 0.1 /100 | #273 | Tragic 17.5% |
| Macedonians | 0.1 /100 | #274 | Tragic 17.7% |
| British West Indians | 0.0 /100 | #275 | Tragic 17.7% |
| German Russians | 0.0 /100 | #276 | Tragic 17.7% |
Demographics Similar to Koreans by Single Father Poverty
In terms of single father poverty, the demographic groups most similar to Koreans are Afghan (14.0%, a difference of 0.10%), Filipino (14.0%, a difference of 0.40%), Immigrants from India (14.0%, a difference of 0.41%), Immigrants from Philippines (14.0%, a difference of 0.55%), and Samoan (13.8%, a difference of 1.2%).
| Demographics | Rating | Rank | Single Father Poverty |
| Tsimshian | 100.0 /100 | #3 | Exceptional 12.7% |
| Immigrants | Fiji | 100.0 /100 | #4 | Exceptional 13.2% |
| Immigrants | Ethiopia | 100.0 /100 | #5 | Exceptional 13.4% |
| Ethiopians | 100.0 /100 | #6 | Exceptional 13.5% |
| Immigrants | Taiwan | 100.0 /100 | #7 | Exceptional 13.7% |
| Samoans | 100.0 /100 | #8 | Exceptional 13.8% |
| Afghans | 100.0 /100 | #9 | Exceptional 14.0% |
| Koreans | 100.0 /100 | #10 | Exceptional 14.0% |
| Filipinos | 100.0 /100 | #11 | Exceptional 14.0% |
| Immigrants | India | 100.0 /100 | #12 | Exceptional 14.0% |
| Immigrants | Philippines | 100.0 /100 | #13 | Exceptional 14.0% |
| Immigrants | Vietnam | 100.0 /100 | #14 | Exceptional 14.1% |
| Sri Lankans | 100.0 /100 | #15 | Exceptional 14.2% |
| Immigrants | Iran | 100.0 /100 | #16 | Exceptional 14.2% |
| Immigrants | Hong Kong | 100.0 /100 | #17 | Exceptional 14.2% |