Sioux vs Mexican Single Father Poverty

COMPARE

Sioux
Race
Ancestry
AfghanAfricanAlaska NativeAlaskan AthabascanAlbanianAleutAlsatianAmericanApacheArabArapahoArgentineanArmenianAssyrian/Chaldean/SyriacAustralianAustrianBahamianBangladeshiBarbadianBasqueBelgianBelizeanBermudanBhutaneseBlackfeetBolivianBrazilianBritishBritish West IndianBulgarianBurmeseCajunCambodianCanadianCape VerdeanCarpatho RusynCelticCentral AmericanCentral American IndianCherokeeCheyenneChickasawChileanChineseChippewaChoctawColombianColvilleComancheCosta RicanCreeCreekCroatianCrowCubanCypriotCzechCzechoslovakianDanishDelawareDominicanDutchDutch West IndianEastern EuropeanEcuadorianEgyptianEnglishEstonianEthiopianEuropeanFijianFilipinoFinnishFrenchFrench American IndianFrench CanadianGermanGerman RussianGhanaianGreekGuamanian/ChamorroGuatemalanGuyaneseHaitianHmongHonduranHopiHoumaHungarianIcelanderIndian (Asian)IndonesianInupiatIranianIraqiIrishIroquoisIsraeliItalianJamaicanJapaneseJordanianKenyanKiowaKoreanLaotianLatvianLebaneseLiberianLithuanianLumbeeLuxembourgerMacedonianMalaysianMalteseMarshalleseMenomineeMexican American IndianMongolianMoroccanNative HawaiianNavajoNepaleseNew ZealanderNicaraguanNigerianNorthern EuropeanNorwegianOkinawanOsageOttawaPaiutePakistaniPalestinianPanamanianParaguayanPennsylvania GermanPeruvianPimaPolishPortuguesePotawatomiPuebloPuerto RicanPuget Sound SalishRomanianRussianSalvadoranSamoanScandinavianScotch-IrishScottishSeminoleSenegaleseSerbianShoshoneSierra LeoneanSiouxSlavicSlovakSloveneSomaliSouth AfricanSouth AmericanSouth American IndianSoviet UnionSpaniardSpanishSpanish AmericanSpanish American IndianSri LankanSubsaharan AfricanSudaneseSwedishSwissSyrianTaiwaneseThaiTlingit-HaidaTohono O'OdhamTonganTrinidadian and TobagonianTsimshianTurkishU.S. Virgin IslanderUgandanUkrainianUruguayanUteVenezuelanVietnameseWelshWest IndianYakamaYaquiYugoslavianYumanYup'ikZimbabwean
Immigration
NonimmigrantsImmigrantsAfghanistanAfricaAlbaniaArgentinaArmeniaAsiaAustraliaAustriaBahamasBangladeshBarbadosBelarusBelgiumBelizeBoliviaBosnia and HerzegovinaBrazilBulgariaBurma/MyanmarCabo VerdeCambodiaCameroonCanadaCaribbeanCentral AmericaChileChinaColombiaCongoCosta RicaCroatiaCubaCzechoslovakiaDenmarkDominicaDominican RepublicEastern AfricaEastern AsiaEastern EuropeEcuadorEgyptEl SalvadorEnglandEritreaEthiopiaEuropeFijiFranceGermanyGhanaGreeceGrenadaGuatemalaGuyanaHaitiHondurasHong KongHungaryIndiaIndonesiaIranIraqIrelandIsraelItalyJamaicaJapanJordanKazakhstanKenyaKoreaKuwaitLaosLatin AmericaLatviaLebanonLiberiaLithuaniaMalaysiaMexicoMicronesiaMiddle AfricaMoldovaMoroccoNepalNetherlandsNicaraguaNigeriaNorth AmericaNorth MacedoniaNorthern AfricaNorthern EuropeNorwayOceaniaPakistanPanamaPeruPhilippinesPolandPortugalRomaniaRussiaSaudi ArabiaScotlandSenegalSerbiaSierra LeoneSingaporeSomaliaSouth AfricaSouth AmericaSouth Central AsiaSouth Eastern AsiaSouthern EuropeSpainSri LankaSt. Vincent and the GrenadinesSudanSwedenSwitzerlandSyriaTaiwanThailandTrinidad and TobagoTurkeyUgandaUkraineUruguayUzbekistanVenezuelaVietnamWest IndiesWestern AfricaWestern AsiaWestern EuropeYemenZaireZimbabweAzores
Mexican
Race
Ancestry
AfghanAfricanAlaska NativeAlaskan AthabascanAlbanianAleutAlsatianAmericanApacheArabArapahoArgentineanArmenianAssyrian/Chaldean/SyriacAustralianAustrianBahamianBangladeshiBarbadianBasqueBelgianBelizeanBermudanBhutaneseBlackfeetBolivianBrazilianBritishBritish West IndianBulgarianBurmeseCajunCambodianCanadianCape VerdeanCarpatho RusynCelticCentral AmericanCentral American IndianCherokeeCheyenneChickasawChileanChineseChippewaChoctawColombianColvilleComancheCosta RicanCreeCreekCroatianCrowCubanCypriotCzechCzechoslovakianDanishDelawareDominicanDutchDutch West IndianEastern EuropeanEcuadorianEgyptianEnglishEstonianEthiopianEuropeanFijianFilipinoFinnishFrenchFrench American IndianFrench CanadianGermanGerman RussianGhanaianGreekGuamanian/ChamorroGuatemalanGuyaneseHaitianHmongHonduranHopiHoumaHungarianIcelanderIndian (Asian)IndonesianInupiatIranianIraqiIrishIroquoisIsraeliItalianJamaicanJapaneseJordanianKenyanKiowaKoreanLaotianLatvianLebaneseLiberianLithuanianLumbeeLuxembourgerMacedonianMalaysianMalteseMarshalleseMenomineeMexicanMexican American IndianMongolianMoroccanNative HawaiianNavajoNepaleseNew ZealanderNicaraguanNigerianNorthern EuropeanNorwegianOkinawanOsageOttawaPaiutePakistaniPalestinianPanamanianParaguayanPennsylvania GermanPeruvianPimaPolishPortuguesePotawatomiPuebloPuerto RicanPuget Sound SalishRomanianRussianSalvadoranSamoanScandinavianScotch-IrishScottishSeminoleSenegaleseSerbianShoshoneSierra LeoneanSlavicSlovakSloveneSomaliSouth AfricanSouth AmericanSouth American IndianSoviet UnionSpaniardSpanishSpanish AmericanSpanish American IndianSri LankanSubsaharan AfricanSudaneseSwedishSwissSyrianTaiwaneseThaiTlingit-HaidaTohono O'OdhamTonganTrinidadian and TobagonianTsimshianTurkishU.S. Virgin IslanderUgandanUkrainianUruguayanUteVenezuelanVietnameseWelshWest IndianYakamaYaquiYugoslavianYumanYup'ikZimbabwean
Immigration
NonimmigrantsImmigrantsAfghanistanAfricaAlbaniaArgentinaArmeniaAsiaAustraliaAustriaBahamasBangladeshBarbadosBelarusBelgiumBelizeBoliviaBosnia and HerzegovinaBrazilBulgariaBurma/MyanmarCabo VerdeCambodiaCameroonCanadaCaribbeanCentral AmericaChileChinaColombiaCongoCosta RicaCroatiaCubaCzechoslovakiaDenmarkDominicaDominican RepublicEastern AfricaEastern AsiaEastern EuropeEcuadorEgyptEl SalvadorEnglandEritreaEthiopiaEuropeFijiFranceGermanyGhanaGreeceGrenadaGuatemalaGuyanaHaitiHondurasHong KongHungaryIndiaIndonesiaIranIraqIrelandIsraelItalyJamaicaJapanJordanKazakhstanKenyaKoreaKuwaitLaosLatin AmericaLatviaLebanonLiberiaLithuaniaMalaysiaMexicoMicronesiaMiddle AfricaMoldovaMoroccoNepalNetherlandsNicaraguaNigeriaNorth AmericaNorth MacedoniaNorthern AfricaNorthern EuropeNorwayOceaniaPakistanPanamaPeruPhilippinesPolandPortugalRomaniaRussiaSaudi ArabiaScotlandSenegalSerbiaSierra LeoneSingaporeSomaliaSouth AfricaSouth AmericaSouth Central AsiaSouth Eastern AsiaSouthern EuropeSpainSri LankaSt. Vincent and the GrenadinesSudanSwedenSwitzerlandSyriaTaiwanThailandTrinidad and TobagoTurkeyUgandaUkraineUruguayUzbekistanVenezuelaVietnamWest IndiesWestern AfricaWestern AsiaWestern EuropeYemenZaireZimbabweAzores
Single Father Poverty
Income
Poverty
Unemployment
Labor Participation
Family Structure
Vehicle Availability
Education Level
Disability

Single Father Poverty Comparison

Sioux

Mexicans

Tragic
Good
23.9%
SINGLE FATHER POVERTY
0.0/ 100
METRIC RATING
337th/ 347
METRIC RANK
16.1%
SINGLE FATHER POVERTY
70.1/ 100
METRIC RATING
154th/ 347
METRIC RANK

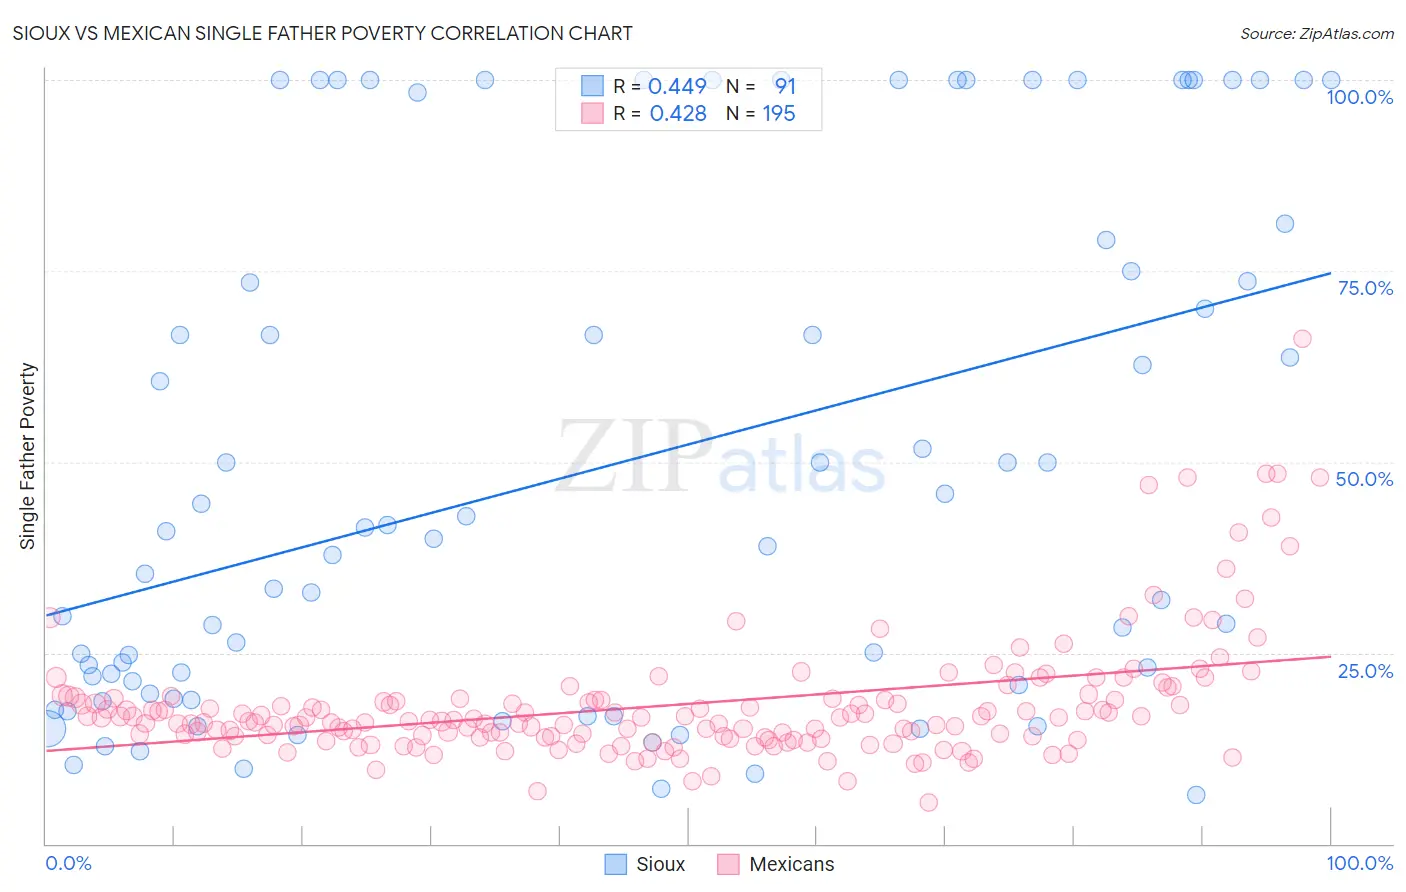
Sioux vs Mexican Single Father Poverty Correlation Chart

The statistical analysis conducted on geographies consisting of 199,784,577 people shows a moderate positive correlation between the proportion of Sioux and poverty level among single fathers in the United States with a correlation coefficient (R) of 0.449 and weighted average of 23.9%. Similarly, the statistical analysis conducted on geographies consisting of 409,525,490 people shows a moderate positive correlation between the proportion of Mexicans and poverty level among single fathers in the United States with a correlation coefficient (R) of 0.428 and weighted average of 16.1%, a difference of 47.9%.
Sioux vs Mexican Single Father Poverty

Single Father Poverty Correlation Summary

MeasurementSiouxMexican
Minimum6.4%5.5%
Maximum100.0%66.2%
Range93.6%60.7%
Mean49.3%18.2%
Median40.0%16.2%
Interquartile 25% (IQ1)19.7%13.9%
Interquartile 75% (IQ3)79.0%19.0%
Interquartile Range (IQR)59.4%5.1%
Standard Deviation (Sample)33.2%8.2%
Standard Deviation (Population)33.1%8.1%

Similar Demographics by Single Father Poverty

Demographics Similar to Sioux by Single Father Poverty

In terms of single father poverty, the demographic groups most similar to Sioux are Arapaho (24.0%, a difference of 0.41%), Apache (24.2%, a difference of 1.5%), Cajun (23.1%, a difference of 3.5%), Shoshone (22.9%, a difference of 4.2%), and Kiowa (22.5%, a difference of 6.3%).
DemographicsRating | RankSingle Father Poverty
Paiute
0.0
/100
|
#330
Tragic
21.6%
Central American Indians
0.0
/100
|
#331
Tragic
21.7%
Tohono O'odham
0.0
/100
|
#332
Tragic
22.0%
Natives/Alaskans
0.0
/100
|
#333
Tragic
22.4%
Kiowa
0.0
/100
|
#334
Tragic
22.5%
Shoshone
0.0
/100
|
#335
Tragic
22.9%
Cajuns
0.0
/100
|
#336
Tragic
23.1%
Sioux
0.0
/100
|
#337
Tragic
23.9%
Arapaho
0.0
/100
|
#338
Tragic
24.0%
Apache
0.0
/100
|
#339
Tragic
24.2%
Houma
0.0
/100
|
#340
Tragic
26.7%
Hopi
0.0
/100
|
#341
Tragic
27.2%
Yuman
0.0
/100
|
#342
Tragic
28.4%
Lumbee
0.0
/100
|
#343
Tragic
28.5%
Navajo
0.0
/100
|
#344
Tragic
29.2%

Demographics Similar to Mexicans by Single Father Poverty

In terms of single father poverty, the demographic groups most similar to Mexicans are Immigrants from Zimbabwe (16.1%, a difference of 0.10%), Immigrants from Israel (16.1%, a difference of 0.10%), Immigrants from Nicaragua (16.2%, a difference of 0.12%), Immigrants from France (16.1%, a difference of 0.16%), and Immigrants from Jordan (16.2%, a difference of 0.21%).
DemographicsRating | RankSingle Father Poverty
Colombians
77.1
/100
|
#147
Good
16.1%
Nigerians
76.8
/100
|
#148
Good
16.1%
South Africans
75.1
/100
|
#149
Good
16.1%
Jordanians
74.2
/100
|
#150
Good
16.1%
Immigrants | France
73.1
/100
|
#151
Good
16.1%
Immigrants | Zimbabwe
72.1
/100
|
#152
Good
16.1%
Immigrants | Israel
72.0
/100
|
#153
Good
16.1%
Mexicans
70.1
/100
|
#154
Good
16.1%
Immigrants | Nicaragua
67.8
/100
|
#155
Good
16.2%
Immigrants | Jordan
66.0
/100
|
#156
Good
16.2%
Immigrants | Czechoslovakia
62.8
/100
|
#157
Good
16.2%
Portuguese
62.3
/100
|
#158
Good
16.2%
Belizeans
59.9
/100
|
#159
Average
16.2%
Immigrants | Sudan
59.8
/100
|
#160
Average
16.2%
Estonians
56.7
/100
|
#161
Average
16.2%