Sioux vs Immigrants from Jordan Child Poverty Among Boys Under 16

COMPARE

Sioux
Race
Ancestry
AfghanAfricanAlaska NativeAlaskan AthabascanAlbanianAleutAlsatianAmericanApacheArabArapahoArgentineanArmenianAssyrian/Chaldean/SyriacAustralianAustrianBahamianBangladeshiBarbadianBasqueBelgianBelizeanBermudanBhutaneseBlackfeetBolivianBrazilianBritishBritish West IndianBulgarianBurmeseCajunCambodianCanadianCape VerdeanCarpatho RusynCelticCentral AmericanCentral American IndianCherokeeCheyenneChickasawChileanChineseChippewaChoctawColombianColvilleComancheCosta RicanCreeCreekCroatianCrowCubanCypriotCzechCzechoslovakianDanishDelawareDominicanDutchDutch West IndianEastern EuropeanEcuadorianEgyptianEnglishEstonianEthiopianEuropeanFijianFilipinoFinnishFrenchFrench American IndianFrench CanadianGermanGerman RussianGhanaianGreekGuamanian/ChamorroGuatemalanGuyaneseHaitianHmongHonduranHopiHoumaHungarianIcelanderIndian (Asian)IndonesianInupiatIranianIraqiIrishIroquoisIsraeliItalianJamaicanJapaneseJordanianKenyanKiowaKoreanLaotianLatvianLebaneseLiberianLithuanianLumbeeLuxembourgerMacedonianMalaysianMalteseMarshalleseMenomineeMexicanMexican American IndianMongolianMoroccanNative HawaiianNavajoNepaleseNew ZealanderNicaraguanNigerianNorthern EuropeanNorwegianOkinawanOsageOttawaPaiutePakistaniPalestinianPanamanianParaguayanPennsylvania GermanPeruvianPimaPolishPortuguesePotawatomiPuebloPuerto RicanPuget Sound SalishRomanianRussianSalvadoranSamoanScandinavianScotch-IrishScottishSeminoleSenegaleseSerbianShoshoneSierra LeoneanSiouxSlavicSlovakSloveneSomaliSouth AfricanSouth AmericanSouth American IndianSoviet UnionSpaniardSpanishSpanish AmericanSpanish American IndianSri LankanSubsaharan AfricanSudaneseSwedishSwissSyrianTaiwaneseThaiTlingit-HaidaTohono O'OdhamTonganTrinidadian and TobagonianTsimshianTurkishU.S. Virgin IslanderUgandanUkrainianUruguayanUteVenezuelanVietnameseWelshWest IndianYakamaYaquiYugoslavianYumanYup'ikZimbabwean
Immigration
NonimmigrantsImmigrantsAfghanistanAfricaAlbaniaArgentinaArmeniaAsiaAustraliaAustriaBahamasBangladeshBarbadosBelarusBelgiumBelizeBoliviaBosnia and HerzegovinaBrazilBulgariaBurma/MyanmarCabo VerdeCambodiaCameroonCanadaCaribbeanCentral AmericaChileChinaColombiaCongoCosta RicaCroatiaCubaCzechoslovakiaDenmarkDominicaDominican RepublicEastern AfricaEastern AsiaEastern EuropeEcuadorEgyptEl SalvadorEnglandEritreaEthiopiaEuropeFijiFranceGermanyGhanaGreeceGrenadaGuatemalaGuyanaHaitiHondurasHong KongHungaryIndiaIndonesiaIranIraqIrelandIsraelItalyJamaicaJapanKazakhstanKenyaKoreaKuwaitLaosLatin AmericaLatviaLebanonLiberiaLithuaniaMalaysiaMexicoMicronesiaMiddle AfricaMoldovaMoroccoNepalNetherlandsNicaraguaNigeriaNorth AmericaNorth MacedoniaNorthern AfricaNorthern EuropeNorwayOceaniaPakistanPanamaPeruPhilippinesPolandPortugalRomaniaRussiaSaudi ArabiaScotlandSenegalSerbiaSierra LeoneSingaporeSomaliaSouth AfricaSouth AmericaSouth Central AsiaSouth Eastern AsiaSouthern EuropeSpainSri LankaSt. Vincent and the GrenadinesSudanSwedenSwitzerlandSyriaTaiwanThailandTrinidad and TobagoTurkeyUgandaUkraineUruguayUzbekistanVenezuelaVietnamWest IndiesWestern AfricaWestern AsiaWestern EuropeYemenZaireZimbabweAzores
Immigrants from Jordan
Race
Ancestry
AfghanAfricanAlaska NativeAlaskan AthabascanAlbanianAleutAlsatianAmericanApacheArabArapahoArgentineanArmenianAssyrian/Chaldean/SyriacAustralianAustrianBahamianBangladeshiBarbadianBasqueBelgianBelizeanBermudanBhutaneseBlackfeetBolivianBrazilianBritishBritish West IndianBulgarianBurmeseCajunCambodianCanadianCape VerdeanCarpatho RusynCelticCentral AmericanCentral American IndianCherokeeCheyenneChickasawChileanChineseChippewaChoctawColombianColvilleComancheCosta RicanCreeCreekCroatianCrowCubanCypriotCzechCzechoslovakianDanishDelawareDominicanDutchDutch West IndianEastern EuropeanEcuadorianEgyptianEnglishEstonianEthiopianEuropeanFijianFilipinoFinnishFrenchFrench American IndianFrench CanadianGermanGerman RussianGhanaianGreekGuamanian/ChamorroGuatemalanGuyaneseHaitianHmongHonduranHopiHoumaHungarianIcelanderIndian (Asian)IndonesianInupiatIranianIraqiIrishIroquoisIsraeliItalianJamaicanJapaneseJordanianKenyanKiowaKoreanLaotianLatvianLebaneseLiberianLithuanianLumbeeLuxembourgerMacedonianMalaysianMalteseMarshalleseMenomineeMexicanMexican American IndianMongolianMoroccanNative HawaiianNavajoNepaleseNew ZealanderNicaraguanNigerianNorthern EuropeanNorwegianOkinawanOsageOttawaPaiutePakistaniPalestinianPanamanianParaguayanPennsylvania GermanPeruvianPimaPolishPortuguesePotawatomiPuebloPuerto RicanPuget Sound SalishRomanianRussianSalvadoranSamoanScandinavianScotch-IrishScottishSeminoleSenegaleseSerbianShoshoneSierra LeoneanSlavicSlovakSloveneSomaliSouth AfricanSouth AmericanSouth American IndianSoviet UnionSpaniardSpanishSpanish AmericanSpanish American IndianSri LankanSubsaharan AfricanSudaneseSwedishSwissSyrianTaiwaneseThaiTlingit-HaidaTohono O'OdhamTonganTrinidadian and TobagonianTsimshianTurkishU.S. Virgin IslanderUgandanUkrainianUruguayanUteVenezuelanVietnameseWelshWest IndianYakamaYaquiYugoslavianYumanYup'ikZimbabwean
Immigration
NonimmigrantsImmigrantsAfghanistanAfricaAlbaniaArgentinaArmeniaAsiaAustraliaAustriaBahamasBangladeshBarbadosBelarusBelgiumBelizeBoliviaBosnia and HerzegovinaBrazilBulgariaBurma/MyanmarCabo VerdeCambodiaCameroonCanadaCaribbeanCentral AmericaChileChinaColombiaCongoCosta RicaCroatiaCubaCzechoslovakiaDenmarkDominicaDominican RepublicEastern AfricaEastern AsiaEastern EuropeEcuadorEgyptEl SalvadorEnglandEritreaEthiopiaEuropeFijiFranceGermanyGhanaGreeceGrenadaGuatemalaGuyanaHaitiHondurasHong KongHungaryIndiaIndonesiaIranIraqIrelandIsraelItalyJamaicaJapanJordanKazakhstanKenyaKoreaKuwaitLaosLatin AmericaLatviaLebanonLiberiaLithuaniaMalaysiaMexicoMicronesiaMiddle AfricaMoldovaMoroccoNepalNetherlandsNicaraguaNigeriaNorth AmericaNorth MacedoniaNorthern AfricaNorthern EuropeNorwayOceaniaPakistanPanamaPeruPhilippinesPolandPortugalRomaniaRussiaSaudi ArabiaScotlandSenegalSerbiaSierra LeoneSingaporeSomaliaSouth AfricaSouth AmericaSouth Central AsiaSouth Eastern AsiaSouthern EuropeSpainSri LankaSt. Vincent and the GrenadinesSudanSwedenSwitzerlandSyriaTaiwanThailandTrinidad and TobagoTurkeyUgandaUkraineUruguayUzbekistanVenezuelaVietnamWest IndiesWestern AfricaWestern AsiaWestern EuropeYemenZaireZimbabweAzores
Child Poverty Among Boys Under 16
Income
Poverty
Unemployment
Labor Participation
Family Structure
Vehicle Availability
Education Level
Disability

Child Poverty Among Boys Under 16 Comparison

Sioux

Immigrants from Jordan

Tragic
Excellent
25.3%
CHILD POVERTY AMONG BOYS UNDER 16
0.0/ 100
METRIC RATING
336th/ 347
METRIC RANK
15.8%
CHILD POVERTY AMONG BOYS UNDER 16
80.2/ 100
METRIC RATING
150th/ 347
METRIC RANK

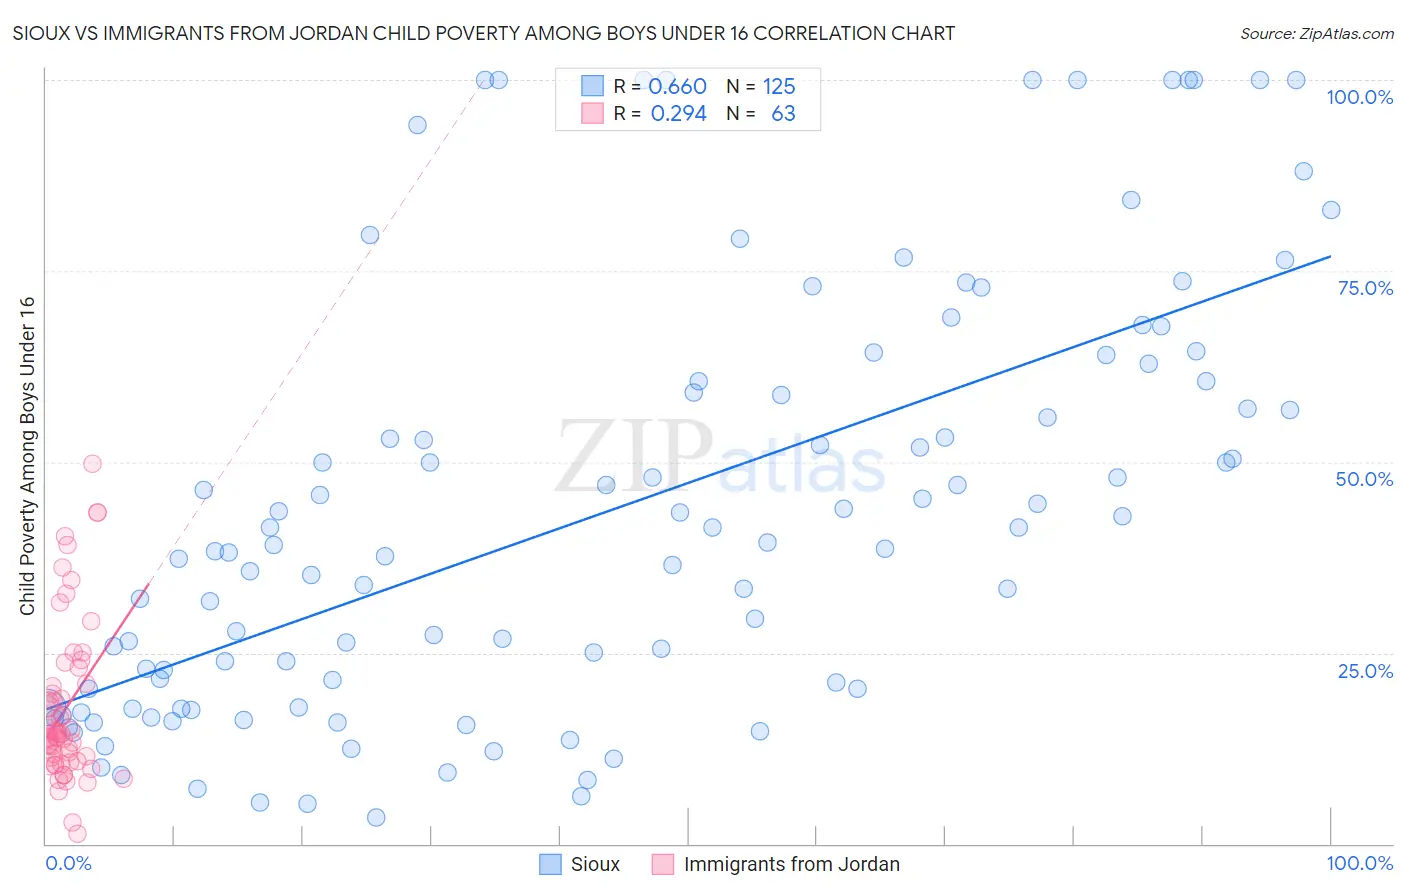
Sioux vs Immigrants from Jordan Child Poverty Among Boys Under 16 Correlation Chart

The statistical analysis conducted on geographies consisting of 232,204,453 people shows a significant positive correlation between the proportion of Sioux and poverty level among boys under the age of 16 in the United States with a correlation coefficient (R) of 0.660 and weighted average of 25.3%. Similarly, the statistical analysis conducted on geographies consisting of 180,176,549 people shows a weak positive correlation between the proportion of Immigrants from Jordan and poverty level among boys under the age of 16 in the United States with a correlation coefficient (R) of 0.294 and weighted average of 15.8%, a difference of 60.2%.
Sioux vs Immigrants from Jordan Child Poverty Among Boys Under 16

Child Poverty Among Boys Under 16 Correlation Summary

MeasurementSiouxImmigrants from Jordan
Minimum3.4%1.3%
Maximum100.0%49.7%
Range96.6%48.5%
Mean43.5%17.7%
Median39.1%14.4%
Interquartile 25% (IQ1)19.1%10.8%
Interquartile 75% (IQ3)60.5%20.9%
Interquartile Range (IQR)41.5%10.1%
Standard Deviation (Sample)27.5%10.3%
Standard Deviation (Population)27.4%10.3%

Similar Demographics by Child Poverty Among Boys Under 16

Demographics Similar to Sioux by Child Poverty Among Boys Under 16

In terms of child poverty among boys under 16, the demographic groups most similar to Sioux are Cheyenne (25.8%, a difference of 2.0%), Yup'ik (24.7%, a difference of 2.3%), Hopi (25.9%, a difference of 2.5%), Black/African American (24.5%, a difference of 3.2%), and Apache (24.5%, a difference of 3.3%).
DemographicsRating | RankChild Poverty Among Boys Under 16
Natives/Alaskans
0.0
/100
|
#329
Tragic
24.0%
Colville
0.0
/100
|
#330
Tragic
24.1%
Dominicans
0.0
/100
|
#331
Tragic
24.2%
Immigrants | Dominican Republic
0.0
/100
|
#332
Tragic
24.3%
Apache
0.0
/100
|
#333
Tragic
24.5%
Blacks/African Americans
0.0
/100
|
#334
Tragic
24.5%
Yup'ik
0.0
/100
|
#335
Tragic
24.7%
Sioux
0.0
/100
|
#336
Tragic
25.3%
Cheyenne
0.0
/100
|
#337
Tragic
25.8%
Hopi
0.0
/100
|
#338
Tragic
25.9%
Houma
0.0
/100
|
#339
Tragic
26.2%
Crow
0.0
/100
|
#340
Tragic
26.3%
Immigrants | Yemen
0.0
/100
|
#341
Tragic
28.9%
Pima
0.0
/100
|
#342
Tragic
29.7%
Navajo
0.0
/100
|
#343
Tragic
30.3%

Demographics Similar to Immigrants from Jordan by Child Poverty Among Boys Under 16

In terms of child poverty among boys under 16, the demographic groups most similar to Immigrants from Jordan are Slovak (15.8%, a difference of 0.010%), Puget Sound Salish (15.8%, a difference of 0.080%), Immigrants from Venezuela (15.8%, a difference of 0.13%), Brazilian (15.8%, a difference of 0.15%), and French (15.8%, a difference of 0.27%).
DemographicsRating | RankChild Poverty Among Boys Under 16
Immigrants | Fiji
83.6
/100
|
#143
Excellent
15.7%
Immigrants | Peru
83.5
/100
|
#144
Excellent
15.7%
Samoans
83.2
/100
|
#145
Excellent
15.7%
New Zealanders
82.4
/100
|
#146
Excellent
15.7%
Venezuelans
82.1
/100
|
#147
Excellent
15.7%
Brazilians
81.0
/100
|
#148
Excellent
15.8%
Slovaks
80.3
/100
|
#149
Excellent
15.8%
Immigrants | Jordan
80.2
/100
|
#150
Excellent
15.8%
Puget Sound Salish
79.8
/100
|
#151
Good
15.8%
Immigrants | Venezuela
79.5
/100
|
#152
Good
15.8%
French
78.7
/100
|
#153
Good
15.8%
Syrians
77.5
/100
|
#154
Good
15.9%
French Canadians
76.6
/100
|
#155
Good
15.9%
Israelis
76.5
/100
|
#156
Good
15.9%
Immigrants | Nepal
76.0
/100
|
#157
Good
15.9%