Sierra Leonean vs Norwegian Female Poverty
COMPARE
Sierra Leonean
Norwegian
Female Poverty
Female Poverty Comparison
Sierra Leoneans
Norwegians
13.7%
FEMALE POVERTY
33.1/ 100
METRIC RATING
190th/ 347
METRIC RANK
11.5%
FEMALE POVERTY
99.8/ 100
METRIC RATING
19th/ 347
METRIC RANK
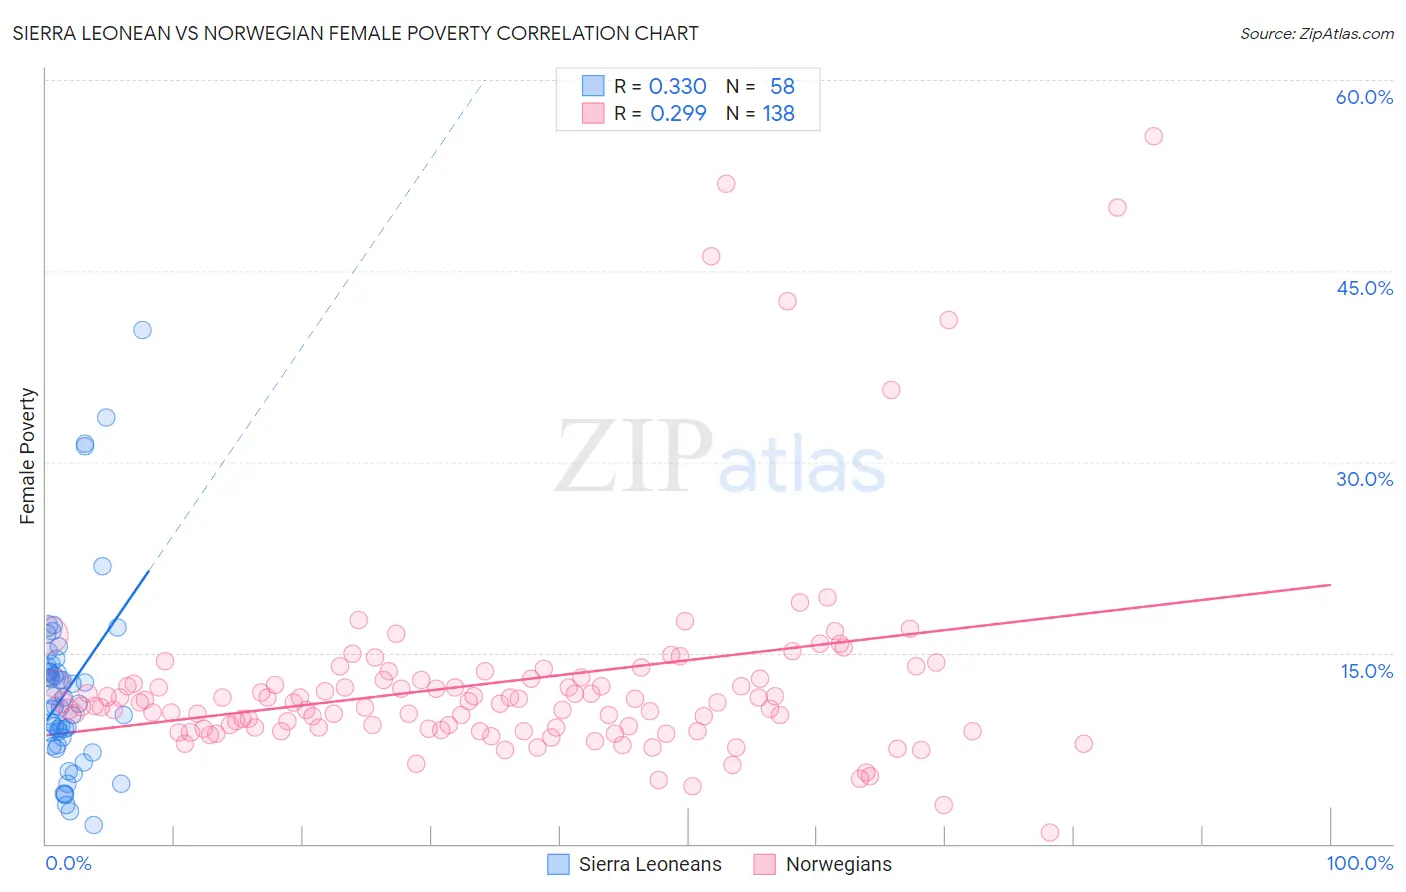
Sierra Leonean vs Norwegian Female Poverty Correlation Chart
The statistical analysis conducted on geographies consisting of 83,350,076 people shows a mild positive correlation between the proportion of Sierra Leoneans and poverty level among females in the United States with a correlation coefficient (R) of 0.330 and weighted average of 13.7%. Similarly, the statistical analysis conducted on geographies consisting of 532,481,223 people shows a weak positive correlation between the proportion of Norwegians and poverty level among females in the United States with a correlation coefficient (R) of 0.299 and weighted average of 11.5%, a difference of 18.8%.
Female Poverty Correlation Summary
| Measurement | Sierra Leonean | Norwegian |
| Minimum | 1.5% | 0.92% |
| Maximum | 40.4% | 55.6% |
| Range | 38.9% | 54.6% |
| Mean | 12.1% | 12.7% |
| Median | 10.9% | 11.1% |
| Interquartile 25% (IQ1) | 7.8% | 9.0% |
| Interquartile 75% (IQ3) | 13.9% | 12.9% |
| Interquartile Range (IQR) | 6.1% | 3.8% |
| Standard Deviation (Sample) | 7.4% | 8.4% |
| Standard Deviation (Population) | 7.4% | 8.4% |
Similar Demographics by Female Poverty
Demographics Similar to Sierra Leoneans by Female Poverty
In terms of female poverty, the demographic groups most similar to Sierra Leoneans are Immigrants from Kuwait (13.7%, a difference of 0.040%), Immigrants from Costa Rica (13.7%, a difference of 0.13%), Iraqi (13.7%, a difference of 0.14%), Delaware (13.7%, a difference of 0.21%), and Immigrants from South America (13.7%, a difference of 0.27%).
| Demographics | Rating | Rank | Female Poverty |
| Kenyans | 43.8 /100 | #183 | Average 13.5% |
| Immigrants | Sierra Leone | 43.2 /100 | #184 | Average 13.5% |
| Immigrants | Cameroon | 42.0 /100 | #185 | Average 13.5% |
| Immigrants | Portugal | 41.5 /100 | #186 | Average 13.6% |
| Immigrants | Venezuela | 41.0 /100 | #187 | Average 13.6% |
| Hawaiians | 39.9 /100 | #188 | Fair 13.6% |
| Uruguayans | 39.8 /100 | #189 | Fair 13.6% |
| Sierra Leoneans | 33.1 /100 | #190 | Fair 13.7% |
| Immigrants | Kuwait | 32.7 /100 | #191 | Fair 13.7% |
| Immigrants | Costa Rica | 31.9 /100 | #192 | Fair 13.7% |
| Iraqis | 31.8 /100 | #193 | Fair 13.7% |
| Delaware | 31.1 /100 | #194 | Fair 13.7% |
| Immigrants | South America | 30.6 /100 | #195 | Fair 13.7% |
| South American Indians | 28.9 /100 | #196 | Fair 13.7% |
| Arabs | 28.6 /100 | #197 | Fair 13.7% |
Demographics Similar to Norwegians by Female Poverty
In terms of female poverty, the demographic groups most similar to Norwegians are Immigrants from Scotland (11.5%, a difference of 0.040%), Bolivian (11.5%, a difference of 0.090%), Immigrants from Bolivia (11.5%, a difference of 0.16%), Eastern European (11.5%, a difference of 0.23%), and Latvian (11.4%, a difference of 0.64%).
| Demographics | Rating | Rank | Female Poverty |
| Bhutanese | 99.9 /100 | #12 | Exceptional 11.3% |
| Immigrants | Lithuania | 99.9 /100 | #13 | Exceptional 11.3% |
| Lithuanians | 99.8 /100 | #14 | Exceptional 11.4% |
| Latvians | 99.8 /100 | #15 | Exceptional 11.4% |
| Immigrants | Bolivia | 99.8 /100 | #16 | Exceptional 11.5% |
| Bolivians | 99.8 /100 | #17 | Exceptional 11.5% |
| Immigrants | Scotland | 99.8 /100 | #18 | Exceptional 11.5% |
| Norwegians | 99.8 /100 | #19 | Exceptional 11.5% |
| Eastern Europeans | 99.7 /100 | #20 | Exceptional 11.5% |
| Italians | 99.7 /100 | #21 | Exceptional 11.6% |
| Swedes | 99.7 /100 | #22 | Exceptional 11.6% |
| Burmese | 99.7 /100 | #23 | Exceptional 11.6% |
| Luxembourgers | 99.7 /100 | #24 | Exceptional 11.6% |
| Immigrants | Northern Europe | 99.6 /100 | #25 | Exceptional 11.6% |
| Croatians | 99.6 /100 | #26 | Exceptional 11.6% |