Shoshone vs Immigrants from Spain Single Father Poverty

COMPARE

Shoshone
Race
Ancestry
AfghanAfricanAlaska NativeAlaskan AthabascanAlbanianAleutAlsatianAmericanApacheArabArapahoArgentineanArmenianAssyrian/Chaldean/SyriacAustralianAustrianBahamianBangladeshiBarbadianBasqueBelgianBelizeanBermudanBhutaneseBlackfeetBolivianBrazilianBritishBritish West IndianBulgarianBurmeseCajunCambodianCanadianCape VerdeanCarpatho RusynCelticCentral AmericanCentral American IndianCherokeeCheyenneChickasawChileanChineseChippewaChoctawColombianColvilleComancheCosta RicanCreeCreekCroatianCrowCubanCypriotCzechCzechoslovakianDanishDelawareDominicanDutchDutch West IndianEastern EuropeanEcuadorianEgyptianEnglishEstonianEthiopianEuropeanFijianFilipinoFinnishFrenchFrench American IndianFrench CanadianGermanGerman RussianGhanaianGreekGuamanian/ChamorroGuatemalanGuyaneseHaitianHmongHonduranHopiHoumaHungarianIcelanderIndian (Asian)IndonesianInupiatIranianIraqiIrishIroquoisIsraeliItalianJamaicanJapaneseJordanianKenyanKiowaKoreanLaotianLatvianLebaneseLiberianLithuanianLumbeeLuxembourgerMacedonianMalaysianMalteseMarshalleseMenomineeMexicanMexican American IndianMongolianMoroccanNative HawaiianNavajoNepaleseNew ZealanderNicaraguanNigerianNorthern EuropeanNorwegianOkinawanOsageOttawaPaiutePakistaniPalestinianPanamanianParaguayanPennsylvania GermanPeruvianPimaPolishPortuguesePotawatomiPuebloPuerto RicanPuget Sound SalishRomanianRussianSalvadoranSamoanScandinavianScotch-IrishScottishSeminoleSenegaleseSerbianShoshoneSierra LeoneanSiouxSlavicSlovakSloveneSomaliSouth AfricanSouth AmericanSouth American IndianSoviet UnionSpaniardSpanishSpanish AmericanSpanish American IndianSri LankanSubsaharan AfricanSudaneseSwedishSwissSyrianTaiwaneseThaiTlingit-HaidaTohono O'OdhamTonganTrinidadian and TobagonianTsimshianTurkishU.S. Virgin IslanderUgandanUkrainianUruguayanUteVenezuelanVietnameseWelshWest IndianYakamaYaquiYugoslavianYumanYup'ikZimbabwean
Immigration
NonimmigrantsImmigrantsAfghanistanAfricaAlbaniaArgentinaArmeniaAsiaAustraliaAustriaBahamasBangladeshBarbadosBelarusBelgiumBelizeBoliviaBosnia and HerzegovinaBrazilBulgariaBurma/MyanmarCabo VerdeCambodiaCameroonCanadaCaribbeanCentral AmericaChileChinaColombiaCongoCosta RicaCroatiaCubaCzechoslovakiaDenmarkDominicaDominican RepublicEastern AfricaEastern AsiaEastern EuropeEcuadorEgyptEl SalvadorEnglandEritreaEthiopiaEuropeFijiFranceGermanyGhanaGreeceGrenadaGuatemalaGuyanaHaitiHondurasHong KongHungaryIndiaIndonesiaIranIraqIrelandIsraelItalyJamaicaJapanJordanKazakhstanKenyaKoreaKuwaitLaosLatin AmericaLatviaLebanonLiberiaLithuaniaMalaysiaMexicoMicronesiaMiddle AfricaMoldovaMoroccoNepalNetherlandsNicaraguaNigeriaNorth AmericaNorth MacedoniaNorthern AfricaNorthern EuropeNorwayOceaniaPakistanPanamaPeruPhilippinesPolandPortugalRomaniaRussiaSaudi ArabiaScotlandSenegalSerbiaSierra LeoneSingaporeSomaliaSouth AfricaSouth AmericaSouth Central AsiaSouth Eastern AsiaSouthern EuropeSri LankaSt. Vincent and the GrenadinesSudanSwedenSwitzerlandSyriaTaiwanThailandTrinidad and TobagoTurkeyUgandaUkraineUruguayUzbekistanVenezuelaVietnamWest IndiesWestern AfricaWestern AsiaWestern EuropeYemenZaireZimbabweAzores
Immigrants from Spain
Race
Ancestry
AfghanAfricanAlaska NativeAlaskan AthabascanAlbanianAleutAlsatianAmericanApacheArabArapahoArgentineanArmenianAssyrian/Chaldean/SyriacAustralianAustrianBahamianBangladeshiBarbadianBasqueBelgianBelizeanBermudanBhutaneseBlackfeetBolivianBrazilianBritishBritish West IndianBulgarianBurmeseCajunCambodianCanadianCape VerdeanCarpatho RusynCelticCentral AmericanCentral American IndianCherokeeCheyenneChickasawChileanChineseChippewaChoctawColombianColvilleComancheCosta RicanCreeCreekCroatianCrowCubanCypriotCzechCzechoslovakianDanishDelawareDominicanDutchDutch West IndianEastern EuropeanEcuadorianEgyptianEnglishEstonianEthiopianEuropeanFijianFilipinoFinnishFrenchFrench American IndianFrench CanadianGermanGerman RussianGhanaianGreekGuamanian/ChamorroGuatemalanGuyaneseHaitianHmongHonduranHopiHoumaHungarianIcelanderIndian (Asian)IndonesianInupiatIranianIraqiIrishIroquoisIsraeliItalianJamaicanJapaneseJordanianKenyanKiowaKoreanLaotianLatvianLebaneseLiberianLithuanianLumbeeLuxembourgerMacedonianMalaysianMalteseMarshalleseMenomineeMexicanMexican American IndianMongolianMoroccanNative HawaiianNavajoNepaleseNew ZealanderNicaraguanNigerianNorthern EuropeanNorwegianOkinawanOsageOttawaPaiutePakistaniPalestinianPanamanianParaguayanPennsylvania GermanPeruvianPimaPolishPortuguesePotawatomiPuebloPuerto RicanPuget Sound SalishRomanianRussianSalvadoranSamoanScandinavianScotch-IrishScottishSeminoleSenegaleseSerbianSierra LeoneanSiouxSlavicSlovakSloveneSomaliSouth AfricanSouth AmericanSouth American IndianSoviet UnionSpaniardSpanishSpanish AmericanSpanish American IndianSri LankanSubsaharan AfricanSudaneseSwedishSwissSyrianTaiwaneseThaiTlingit-HaidaTohono O'OdhamTonganTrinidadian and TobagonianTsimshianTurkishU.S. Virgin IslanderUgandanUkrainianUruguayanUteVenezuelanVietnameseWelshWest IndianYakamaYaquiYugoslavianYumanYup'ikZimbabwean
Immigration
NonimmigrantsImmigrantsAfghanistanAfricaAlbaniaArgentinaArmeniaAsiaAustraliaAustriaBahamasBangladeshBarbadosBelarusBelgiumBelizeBoliviaBosnia and HerzegovinaBrazilBulgariaBurma/MyanmarCabo VerdeCambodiaCameroonCanadaCaribbeanCentral AmericaChileChinaColombiaCongoCosta RicaCroatiaCubaCzechoslovakiaDenmarkDominicaDominican RepublicEastern AfricaEastern AsiaEastern EuropeEcuadorEgyptEl SalvadorEnglandEritreaEthiopiaEuropeFijiFranceGermanyGhanaGreeceGrenadaGuatemalaGuyanaHaitiHondurasHong KongHungaryIndiaIndonesiaIranIraqIrelandIsraelItalyJamaicaJapanJordanKazakhstanKenyaKoreaKuwaitLaosLatin AmericaLatviaLebanonLiberiaLithuaniaMalaysiaMexicoMicronesiaMiddle AfricaMoldovaMoroccoNepalNetherlandsNicaraguaNigeriaNorth AmericaNorth MacedoniaNorthern AfricaNorthern EuropeNorwayOceaniaPakistanPanamaPeruPhilippinesPolandPortugalRomaniaRussiaSaudi ArabiaScotlandSenegalSerbiaSierra LeoneSingaporeSomaliaSouth AfricaSouth AmericaSouth Central AsiaSouth Eastern AsiaSouthern EuropeSpainSri LankaSt. Vincent and the GrenadinesSudanSwedenSwitzerlandSyriaTaiwanThailandTrinidad and TobagoTurkeyUgandaUkraineUruguayUzbekistanVenezuelaVietnamWest IndiesWestern AfricaWestern AsiaWestern EuropeYemenZaireZimbabweAzores
Single Father Poverty
Income
Poverty
Unemployment
Labor Participation
Family Structure
Vehicle Availability
Education Level
Disability

Single Father Poverty Comparison

Shoshone

Immigrants from Spain

Tragic
Tragic
22.9%
SINGLE FATHER POVERTY
0.0/ 100
METRIC RATING
335th/ 347
METRIC RANK
16.7%
SINGLE FATHER POVERTY
8.0/ 100
METRIC RATING
222nd/ 347
METRIC RANK

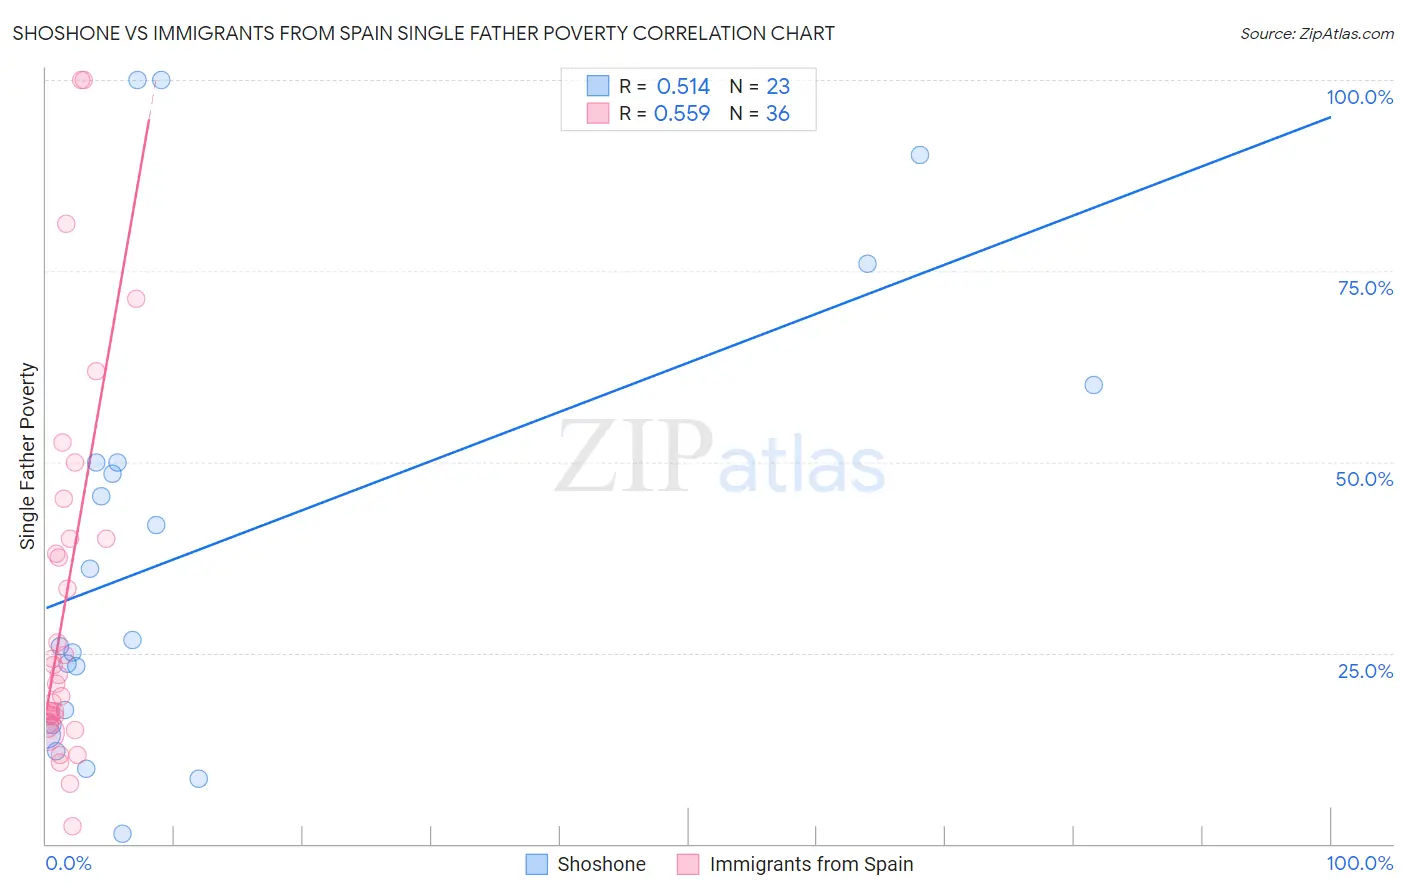
Shoshone vs Immigrants from Spain Single Father Poverty Correlation Chart

The statistical analysis conducted on geographies consisting of 62,234,172 people shows a substantial positive correlation between the proportion of Shoshone and poverty level among single fathers in the United States with a correlation coefficient (R) of 0.514 and weighted average of 22.9%. Similarly, the statistical analysis conducted on geographies consisting of 200,148,614 people shows a substantial positive correlation between the proportion of Immigrants from Spain and poverty level among single fathers in the United States with a correlation coefficient (R) of 0.559 and weighted average of 16.7%, a difference of 36.9%.
Shoshone vs Immigrants from Spain Single Father Poverty

Single Father Poverty Correlation Summary

MeasurementShoshoneImmigrants from Spain
Minimum1.4%2.2%
Maximum100.0%100.0%
Range98.6%97.8%
Mean39.2%31.6%
Median26.6%21.5%
Interquartile 25% (IQ1)15.5%16.2%
Interquartile 75% (IQ3)50.0%40.0%
Interquartile Range (IQR)34.5%23.8%
Standard Deviation (Sample)29.3%24.6%
Standard Deviation (Population)28.6%24.3%

Similar Demographics by Single Father Poverty

Demographics Similar to Shoshone by Single Father Poverty

In terms of single father poverty, the demographic groups most similar to Shoshone are Cajun (23.1%, a difference of 0.71%), Kiowa (22.5%, a difference of 2.0%), Native/Alaskan (22.4%, a difference of 2.3%), Tohono O'odham (22.0%, a difference of 4.1%), and Sioux (23.9%, a difference of 4.2%).
DemographicsRating | RankSingle Father Poverty
Pueblo
0.0
/100
|
#328
Tragic
21.1%
Colville
0.0
/100
|
#329
Tragic
21.4%
Paiute
0.0
/100
|
#330
Tragic
21.6%
Central American Indians
0.0
/100
|
#331
Tragic
21.7%
Tohono O'odham
0.0
/100
|
#332
Tragic
22.0%
Natives/Alaskans
0.0
/100
|
#333
Tragic
22.4%
Kiowa
0.0
/100
|
#334
Tragic
22.5%
Shoshone
0.0
/100
|
#335
Tragic
22.9%
Cajuns
0.0
/100
|
#336
Tragic
23.1%
Sioux
0.0
/100
|
#337
Tragic
23.9%
Arapaho
0.0
/100
|
#338
Tragic
24.0%
Apache
0.0
/100
|
#339
Tragic
24.2%
Houma
0.0
/100
|
#340
Tragic
26.7%
Hopi
0.0
/100
|
#341
Tragic
27.2%
Yuman
0.0
/100
|
#342
Tragic
28.4%

Demographics Similar to Immigrants from Spain by Single Father Poverty

In terms of single father poverty, the demographic groups most similar to Immigrants from Spain are Immigrants from Denmark (16.7%, a difference of 0.010%), Immigrants from Greece (16.7%, a difference of 0.010%), Immigrants from Ghana (16.7%, a difference of 0.020%), Immigrants from Uganda (16.7%, a difference of 0.070%), and Immigrants from Austria (16.8%, a difference of 0.16%).
DemographicsRating | RankSingle Father Poverty
Immigrants | Scotland
9.6
/100
|
#215
Tragic
16.7%
Immigrants | England
9.5
/100
|
#216
Tragic
16.7%
Cheyenne
9.3
/100
|
#217
Tragic
16.7%
Immigrants | Uganda
8.6
/100
|
#218
Tragic
16.7%
Immigrants | Ghana
8.1
/100
|
#219
Tragic
16.7%
Immigrants | Denmark
8.1
/100
|
#220
Tragic
16.7%
Immigrants | Greece
8.1
/100
|
#221
Tragic
16.7%
Immigrants | Spain
8.0
/100
|
#222
Tragic
16.7%
Immigrants | Austria
7.0
/100
|
#223
Tragic
16.8%
Immigrants | Norway
6.5
/100
|
#224
Tragic
16.8%
Menominee
6.4
/100
|
#225
Tragic
16.8%
Hispanics or Latinos
6.1
/100
|
#226
Tragic
16.8%
British
5.6
/100
|
#227
Tragic
16.8%
Belgians
5.3
/100
|
#228
Tragic
16.8%
Israelis
4.6
/100
|
#229
Tragic
16.8%