Shoshone vs Alaska Native Receiving Food Stamps
COMPARE
Shoshone
Alaska Native
Receiving Food Stamps
Receiving Food Stamps Comparison
Shoshone
Alaska Natives
12.4%
RECEIVING FOOD STAMPS
17.7/ 100
METRIC RATING
203rd/ 347
METRIC RANK
15.6%
RECEIVING FOOD STAMPS
0.0/ 100
METRIC RATING
292nd/ 347
METRIC RANK
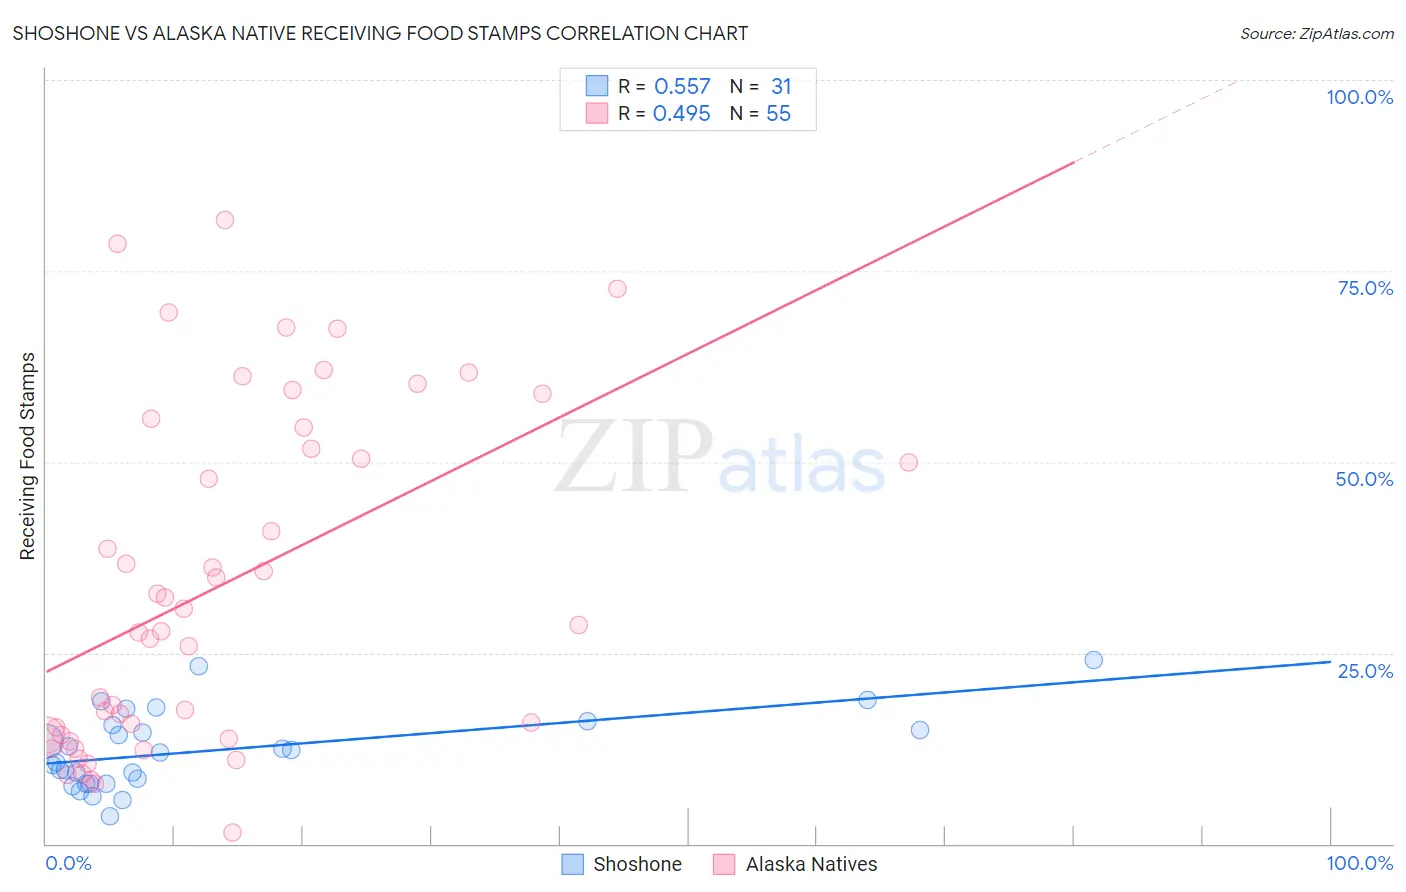
Shoshone vs Alaska Native Receiving Food Stamps Correlation Chart
The statistical analysis conducted on geographies consisting of 66,597,434 people shows a substantial positive correlation between the proportion of Shoshone and percentage of population receiving government assistance and/or food stamps in the United States with a correlation coefficient (R) of 0.557 and weighted average of 12.4%. Similarly, the statistical analysis conducted on geographies consisting of 76,703,689 people shows a moderate positive correlation between the proportion of Alaska Natives and percentage of population receiving government assistance and/or food stamps in the United States with a correlation coefficient (R) of 0.495 and weighted average of 15.6%, a difference of 26.2%.
Receiving Food Stamps Correlation Summary
| Measurement | Shoshone | Alaska Native |
| Minimum | 3.6% | 1.5% |
| Maximum | 24.0% | 81.7% |
| Range | 20.4% | 80.2% |
| Mean | 12.2% | 33.9% |
| Median | 12.0% | 28.6% |
| Interquartile 25% (IQ1) | 7.9% | 14.3% |
| Interquartile 75% (IQ3) | 15.6% | 54.5% |
| Interquartile Range (IQR) | 7.7% | 40.2% |
| Standard Deviation (Sample) | 5.0% | 22.1% |
| Standard Deviation (Population) | 4.9% | 21.9% |
Similar Demographics by Receiving Food Stamps
Demographics Similar to Shoshone by Receiving Food Stamps
In terms of receiving food stamps, the demographic groups most similar to Shoshone are Nonimmigrants (12.4%, a difference of 0.030%), Aleut (12.4%, a difference of 0.090%), Immigrants from Thailand (12.4%, a difference of 0.16%), South American (12.4%, a difference of 0.42%), and Immigrants from Venezuela (12.3%, a difference of 0.53%).
| Demographics | Rating | Rank | Receiving Food Stamps |
| Iraqis | 26.6 /100 | #196 | Fair 12.2% |
| Delaware | 26.1 /100 | #197 | Fair 12.2% |
| Immigrants | Costa Rica | 25.4 /100 | #198 | Fair 12.2% |
| Portuguese | 25.1 /100 | #199 | Fair 12.2% |
| Sierra Leoneans | 23.6 /100 | #200 | Fair 12.2% |
| Ugandans | 22.5 /100 | #201 | Fair 12.2% |
| Immigrants | Venezuela | 20.1 /100 | #202 | Fair 12.3% |
| Shoshone | 17.7 /100 | #203 | Poor 12.4% |
| Immigrants | Nonimmigrants | 17.6 /100 | #204 | Poor 12.4% |
| Aleuts | 17.3 /100 | #205 | Poor 12.4% |
| Immigrants | Thailand | 17.0 /100 | #206 | Poor 12.4% |
| South Americans | 16.0 /100 | #207 | Poor 12.4% |
| Potawatomi | 14.6 /100 | #208 | Poor 12.5% |
| Immigrants | Sierra Leone | 12.9 /100 | #209 | Poor 12.5% |
| Immigrants | Uruguay | 12.8 /100 | #210 | Poor 12.5% |
Demographics Similar to Alaska Natives by Receiving Food Stamps
In terms of receiving food stamps, the demographic groups most similar to Alaska Natives are Vietnamese (15.7%, a difference of 0.30%), Immigrants from Latin America (15.7%, a difference of 0.41%), Honduran (15.5%, a difference of 0.44%), Immigrants from Honduras (15.7%, a difference of 0.74%), and Tsimshian (15.7%, a difference of 0.75%).
| Demographics | Rating | Rank | Receiving Food Stamps |
| Immigrants | Liberia | 0.0 /100 | #285 | Tragic 15.1% |
| Africans | 0.0 /100 | #286 | Tragic 15.1% |
| Immigrants | Mexico | 0.0 /100 | #287 | Tragic 15.2% |
| Immigrants | Belize | 0.0 /100 | #288 | Tragic 15.2% |
| Immigrants | Senegal | 0.0 /100 | #289 | Tragic 15.3% |
| Senegalese | 0.0 /100 | #290 | Tragic 15.4% |
| Hondurans | 0.0 /100 | #291 | Tragic 15.5% |
| Alaska Natives | 0.0 /100 | #292 | Tragic 15.6% |
| Vietnamese | 0.0 /100 | #293 | Tragic 15.7% |
| Immigrants | Latin America | 0.0 /100 | #294 | Tragic 15.7% |
| Immigrants | Honduras | 0.0 /100 | #295 | Tragic 15.7% |
| Tsimshian | 0.0 /100 | #296 | Tragic 15.7% |
| Immigrants | Bahamas | 0.0 /100 | #297 | Tragic 15.8% |
| Immigrants | Trinidad and Tobago | 0.0 /100 | #298 | Tragic 15.8% |
| Hispanics or Latinos | 0.0 /100 | #299 | Tragic 15.8% |