Serbian vs Chickasaw Child Poverty Under the Age of 16
COMPARE
Serbian
Chickasaw
Child Poverty Under the Age of 16
Child Poverty Under the Age of 16 Comparison
Serbians
Chickasaw
14.8%
CHILD POVERTY UNDER THE AGE OF 16
94.5/ 100
METRIC RATING
106th/ 347
METRIC RANK
19.5%
CHILD POVERTY UNDER THE AGE OF 16
0.1/ 100
METRIC RATING
265th/ 347
METRIC RANK
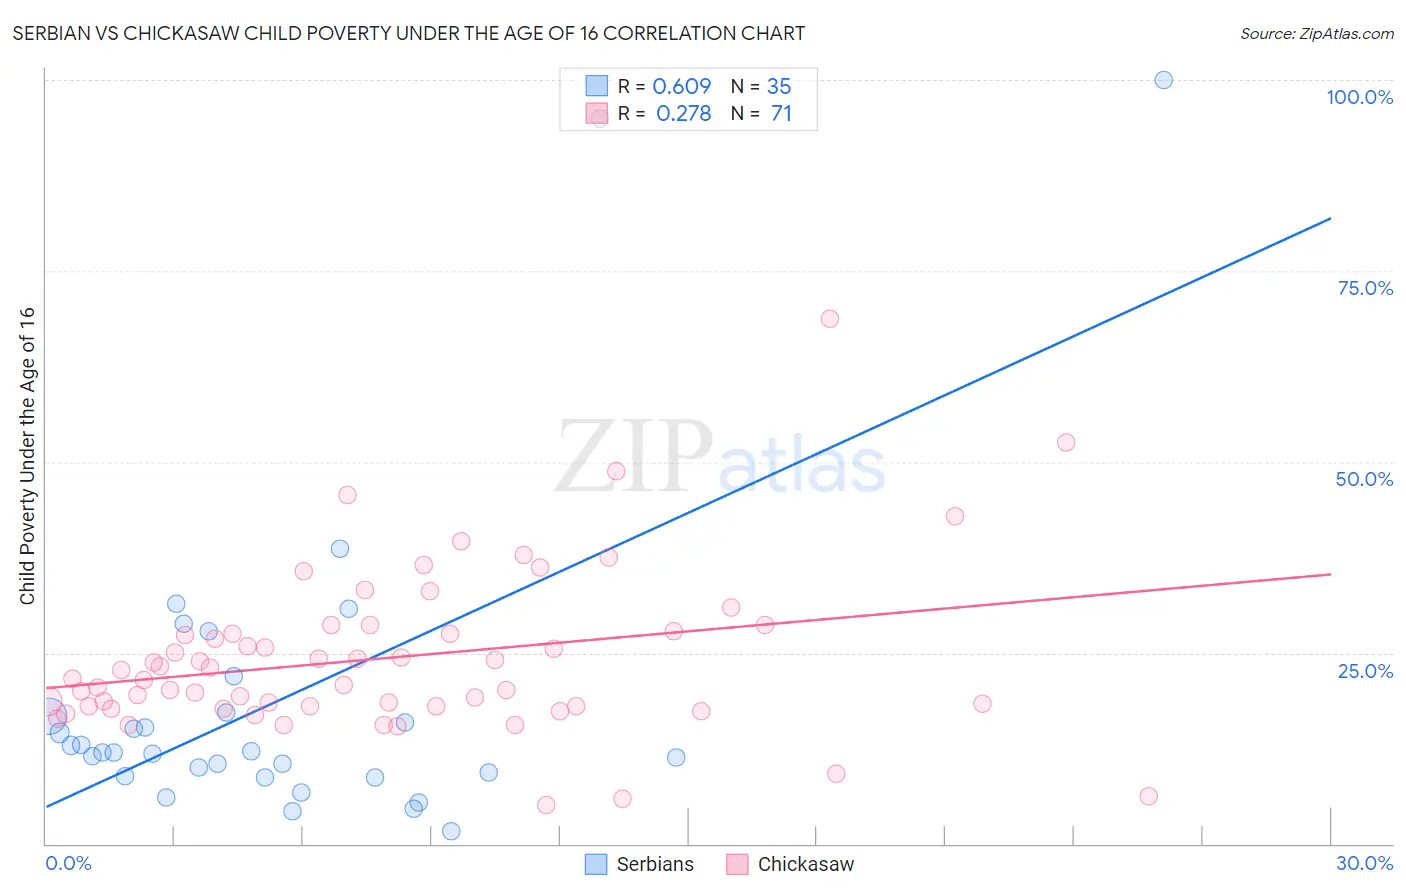
Serbian vs Chickasaw Child Poverty Under the Age of 16 Correlation Chart
The statistical analysis conducted on geographies consisting of 265,642,199 people shows a significant positive correlation between the proportion of Serbians and poverty level among children under the age of 16 in the United States with a correlation coefficient (R) of 0.609 and weighted average of 14.8%. Similarly, the statistical analysis conducted on geographies consisting of 147,366,373 people shows a weak positive correlation between the proportion of Chickasaw and poverty level among children under the age of 16 in the United States with a correlation coefficient (R) of 0.278 and weighted average of 19.5%, a difference of 31.3%.
Child Poverty Under the Age of 16 Correlation Summary
| Measurement | Serbian | Chickasaw |
| Minimum | 1.6% | 5.1% |
| Maximum | 100.0% | 68.8% |
| Range | 98.4% | 63.7% |
| Mean | 18.9% | 24.3% |
| Median | 12.0% | 21.7% |
| Interquartile 25% (IQ1) | 8.9% | 18.0% |
| Interquartile 75% (IQ3) | 17.2% | 27.8% |
| Interquartile Range (IQR) | 8.4% | 9.8% |
| Standard Deviation (Sample) | 21.4% | 10.7% |
| Standard Deviation (Population) | 21.1% | 10.6% |
Similar Demographics by Child Poverty Under the Age of 16
Demographics Similar to Serbians by Child Poverty Under the Age of 16
In terms of child poverty under the age of 16, the demographic groups most similar to Serbians are Chilean (14.8%, a difference of 0.060%), Basque (14.8%, a difference of 0.13%), Jordanian (14.8%, a difference of 0.15%), Tlingit-Haida (14.9%, a difference of 0.22%), and Immigrants from England (14.8%, a difference of 0.24%).
| Demographics | Rating | Rank | Child Poverty Under the Age of 16 |
| British | 95.5 /100 | #99 | Exceptional 14.7% |
| Dutch | 95.1 /100 | #100 | Exceptional 14.8% |
| Immigrants | Switzerland | 95.1 /100 | #101 | Exceptional 14.8% |
| Romanians | 95.0 /100 | #102 | Exceptional 14.8% |
| Immigrants | Egypt | 94.9 /100 | #103 | Exceptional 14.8% |
| Immigrants | England | 94.8 /100 | #104 | Exceptional 14.8% |
| Basques | 94.7 /100 | #105 | Exceptional 14.8% |
| Serbians | 94.5 /100 | #106 | Exceptional 14.8% |
| Chileans | 94.4 /100 | #107 | Exceptional 14.8% |
| Jordanians | 94.2 /100 | #108 | Exceptional 14.8% |
| Tlingit-Haida | 94.1 /100 | #109 | Exceptional 14.9% |
| English | 93.5 /100 | #110 | Exceptional 14.9% |
| Immigrants | Denmark | 93.5 /100 | #111 | Exceptional 14.9% |
| Irish | 93.4 /100 | #112 | Exceptional 14.9% |
| Belgians | 93.3 /100 | #113 | Exceptional 14.9% |
Demographics Similar to Chickasaw by Child Poverty Under the Age of 16
In terms of child poverty under the age of 16, the demographic groups most similar to Chickasaw are Liberian (19.5%, a difference of 0.10%), Immigrants from Ecuador (19.4%, a difference of 0.12%), Vietnamese (19.4%, a difference of 0.18%), Cherokee (19.5%, a difference of 0.40%), and Immigrants from Guyana (19.4%, a difference of 0.49%).
| Demographics | Rating | Rank | Child Poverty Under the Age of 16 |
| Spanish Americans | 0.2 /100 | #258 | Tragic 19.2% |
| Mexican American Indians | 0.2 /100 | #259 | Tragic 19.3% |
| Guyanese | 0.2 /100 | #260 | Tragic 19.3% |
| Immigrants | Burma/Myanmar | 0.1 /100 | #261 | Tragic 19.4% |
| Immigrants | Guyana | 0.1 /100 | #262 | Tragic 19.4% |
| Vietnamese | 0.1 /100 | #263 | Tragic 19.4% |
| Immigrants | Ecuador | 0.1 /100 | #264 | Tragic 19.4% |
| Chickasaw | 0.1 /100 | #265 | Tragic 19.5% |
| Liberians | 0.1 /100 | #266 | Tragic 19.5% |
| Cherokee | 0.1 /100 | #267 | Tragic 19.5% |
| Jamaicans | 0.1 /100 | #268 | Tragic 19.7% |
| Immigrants | El Salvador | 0.1 /100 | #269 | Tragic 19.7% |
| Spanish American Indians | 0.1 /100 | #270 | Tragic 19.7% |
| Immigrants | Liberia | 0.1 /100 | #271 | Tragic 19.7% |
| Immigrants | Bangladesh | 0.1 /100 | #272 | Tragic 19.8% |