Serbian vs Cajun Single Male Poverty
COMPARE
Serbian
Cajun
Single Male Poverty
Single Male Poverty Comparison
Serbians
Cajuns
12.5%
SINGLE MALE POVERTY
87.9/ 100
METRIC RATING
122nd/ 347
METRIC RANK
19.1%
SINGLE MALE POVERTY
0.0/ 100
METRIC RATING
330th/ 347
METRIC RANK
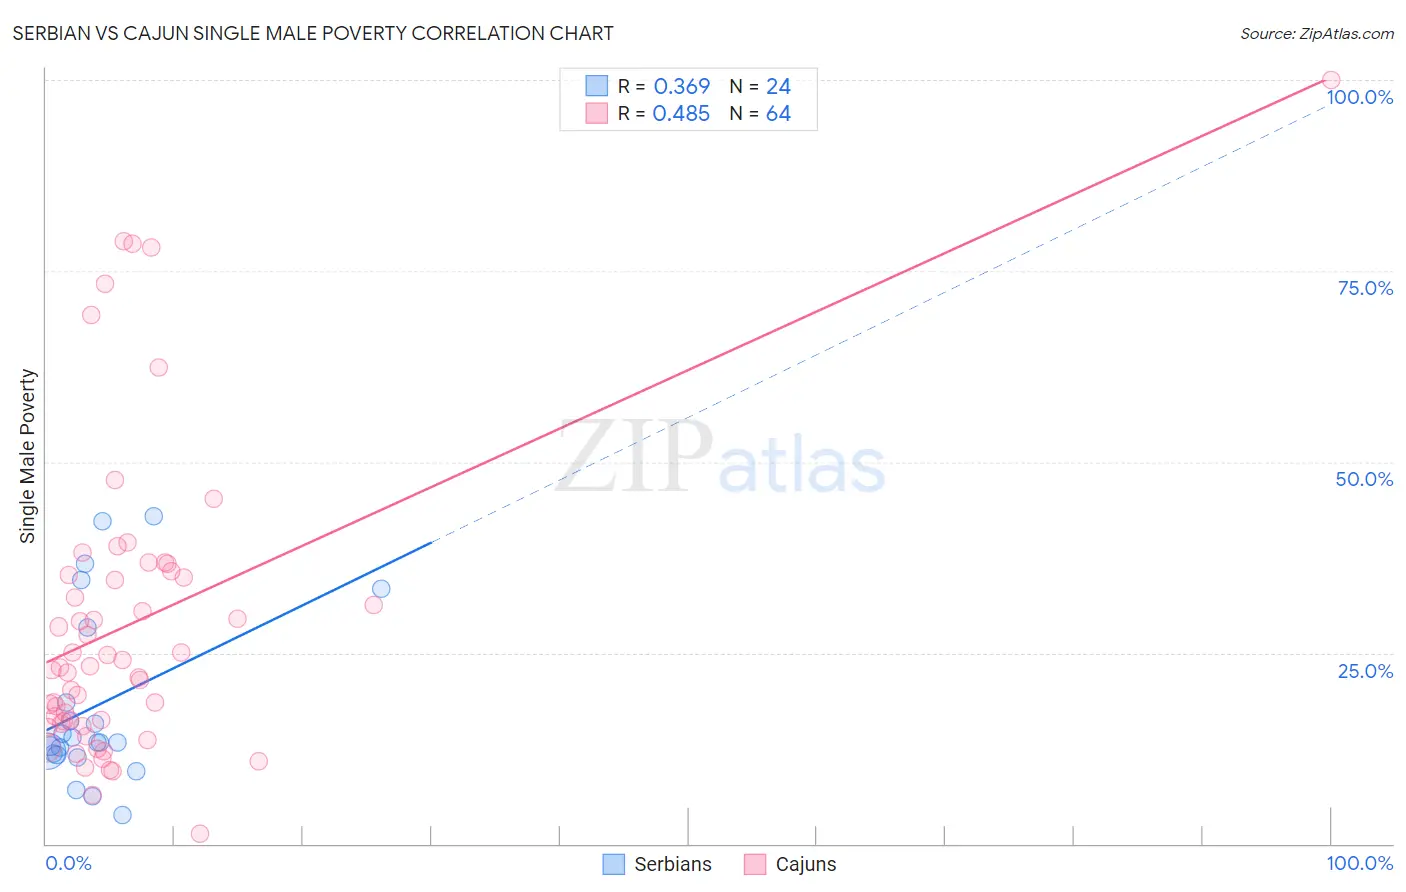
Serbian vs Cajun Single Male Poverty Correlation Chart
The statistical analysis conducted on geographies consisting of 240,171,110 people shows a mild positive correlation between the proportion of Serbians and poverty level among single males in the United States with a correlation coefficient (R) of 0.369 and weighted average of 12.5%. Similarly, the statistical analysis conducted on geographies consisting of 139,673,015 people shows a moderate positive correlation between the proportion of Cajuns and poverty level among single males in the United States with a correlation coefficient (R) of 0.485 and weighted average of 19.1%, a difference of 53.0%.
Single Male Poverty Correlation Summary
| Measurement | Serbian | Cajun |
| Minimum | 3.8% | 1.3% |
| Maximum | 42.9% | 100.0% |
| Range | 39.0% | 98.7% |
| Mean | 18.1% | 28.9% |
| Median | 13.3% | 23.1% |
| Interquartile 25% (IQ1) | 11.7% | 15.9% |
| Interquartile 75% (IQ3) | 23.5% | 35.5% |
| Interquartile Range (IQR) | 11.7% | 19.6% |
| Standard Deviation (Sample) | 11.5% | 20.0% |
| Standard Deviation (Population) | 11.2% | 19.9% |
Similar Demographics by Single Male Poverty
Demographics Similar to Serbians by Single Male Poverty
In terms of single male poverty, the demographic groups most similar to Serbians are Immigrants from Kenya (12.5%, a difference of 0.040%), Icelander (12.5%, a difference of 0.050%), Russian (12.5%, a difference of 0.070%), Immigrants from Jordan (12.5%, a difference of 0.10%), and Romanian (12.5%, a difference of 0.18%).
| Demographics | Rating | Rank | Single Male Poverty |
| Immigrants | Southern Europe | 91.5 /100 | #115 | Exceptional 12.4% |
| Immigrants | Syria | 91.2 /100 | #116 | Exceptional 12.4% |
| Immigrants | Oceania | 91.1 /100 | #117 | Exceptional 12.4% |
| Albanians | 90.6 /100 | #118 | Exceptional 12.4% |
| Immigrants | Albania | 90.3 /100 | #119 | Exceptional 12.4% |
| Venezuelans | 89.4 /100 | #120 | Excellent 12.4% |
| Icelanders | 88.2 /100 | #121 | Excellent 12.5% |
| Serbians | 87.9 /100 | #122 | Excellent 12.5% |
| Immigrants | Kenya | 87.6 /100 | #123 | Excellent 12.5% |
| Russians | 87.3 /100 | #124 | Excellent 12.5% |
| Immigrants | Jordan | 87.1 /100 | #125 | Excellent 12.5% |
| Romanians | 86.4 /100 | #126 | Excellent 12.5% |
| Immigrants | Netherlands | 86.2 /100 | #127 | Excellent 12.5% |
| Ecuadorians | 85.9 /100 | #128 | Excellent 12.5% |
| Immigrants | Sierra Leone | 85.5 /100 | #129 | Excellent 12.5% |
Demographics Similar to Cajuns by Single Male Poverty
In terms of single male poverty, the demographic groups most similar to Cajuns are Paiute (19.3%, a difference of 1.1%), Native/Alaskan (19.6%, a difference of 2.8%), Colville (18.4%, a difference of 3.5%), Kiowa (18.3%, a difference of 4.2%), and Inupiat (20.0%, a difference of 4.8%).
| Demographics | Rating | Rank | Single Male Poverty |
| Creek | 0.0 /100 | #323 | Tragic 16.8% |
| Immigrants | Yemen | 0.0 /100 | #324 | Tragic 16.9% |
| Choctaw | 0.0 /100 | #325 | Tragic 17.0% |
| Central American Indians | 0.0 /100 | #326 | Tragic 17.2% |
| Menominee | 0.0 /100 | #327 | Tragic 17.7% |
| Kiowa | 0.0 /100 | #328 | Tragic 18.3% |
| Colville | 0.0 /100 | #329 | Tragic 18.4% |
| Cajuns | 0.0 /100 | #330 | Tragic 19.1% |
| Paiute | 0.0 /100 | #331 | Tragic 19.3% |
| Natives/Alaskans | 0.0 /100 | #332 | Tragic 19.6% |
| Inupiat | 0.0 /100 | #333 | Tragic 20.0% |
| Pima | 0.0 /100 | #334 | Tragic 20.2% |
| Yuman | 0.0 /100 | #335 | Tragic 21.3% |
| Tohono O'odham | 0.0 /100 | #336 | Tragic 21.6% |
| Apache | 0.0 /100 | #337 | Tragic 21.6% |