Senegalese vs Native Hawaiian Male Poverty
COMPARE
Senegalese
Native Hawaiian
Male Poverty
Male Poverty Comparison
Senegalese
Native Hawaiians
14.1%
MALE POVERTY
0.0/ 100
METRIC RATING
304th/ 347
METRIC RANK
10.7%
MALE POVERTY
87.0/ 100
METRIC RATING
122nd/ 347
METRIC RANK
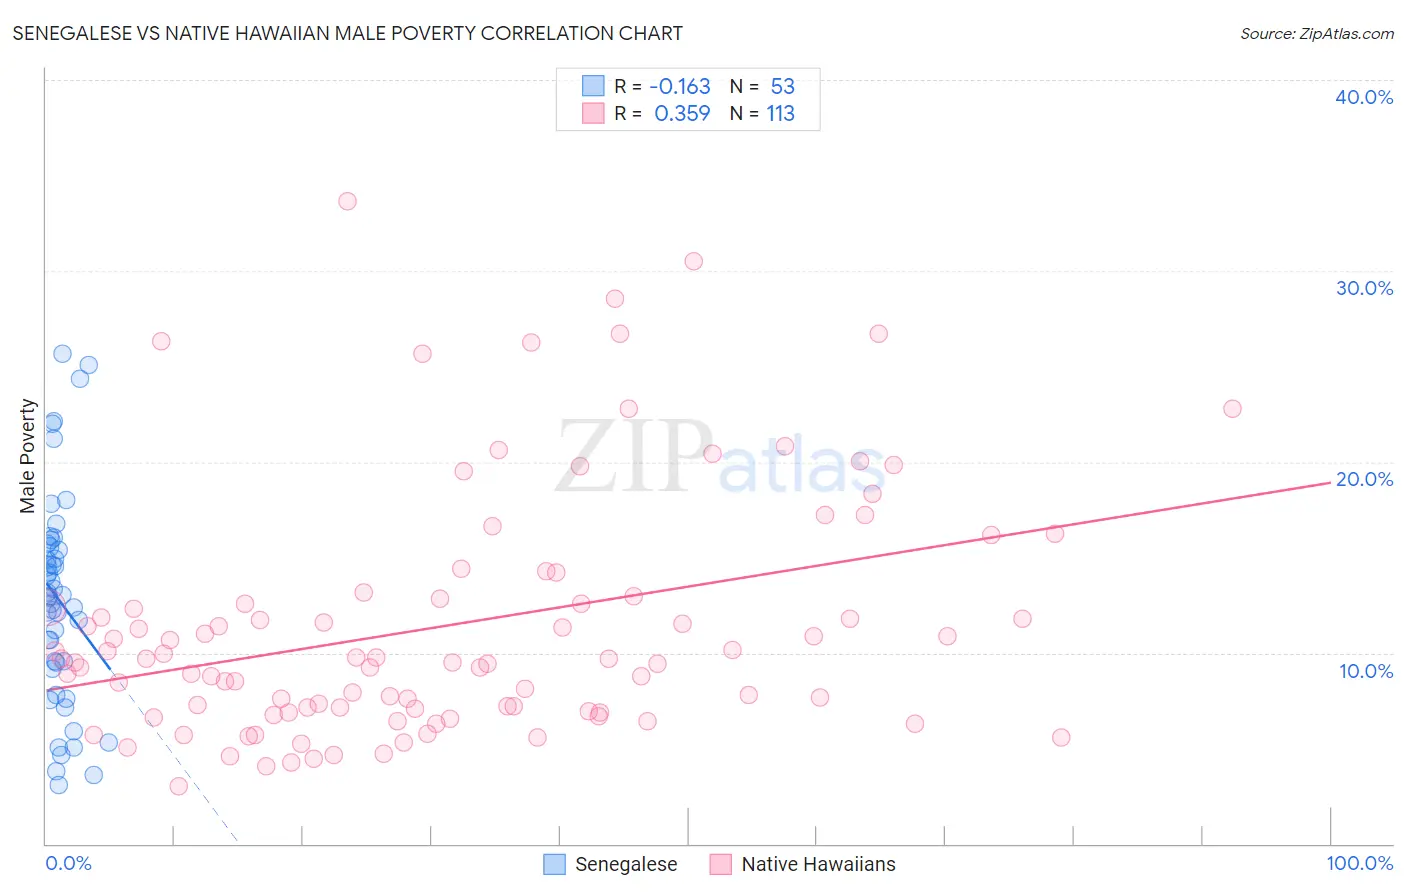
Senegalese vs Native Hawaiian Male Poverty Correlation Chart
The statistical analysis conducted on geographies consisting of 78,114,751 people shows a poor negative correlation between the proportion of Senegalese and poverty level among males in the United States with a correlation coefficient (R) of -0.163 and weighted average of 14.1%. Similarly, the statistical analysis conducted on geographies consisting of 331,823,706 people shows a mild positive correlation between the proportion of Native Hawaiians and poverty level among males in the United States with a correlation coefficient (R) of 0.359 and weighted average of 10.7%, a difference of 31.9%.
Male Poverty Correlation Summary
| Measurement | Senegalese | Native Hawaiian |
| Minimum | 3.1% | 3.0% |
| Maximum | 25.7% | 33.7% |
| Range | 22.6% | 30.7% |
| Mean | 12.8% | 11.4% |
| Median | 13.0% | 9.7% |
| Interquartile 25% (IQ1) | 9.3% | 7.0% |
| Interquartile 75% (IQ3) | 15.6% | 12.9% |
| Interquartile Range (IQR) | 6.3% | 5.9% |
| Standard Deviation (Sample) | 5.5% | 6.4% |
| Standard Deviation (Population) | 5.4% | 6.4% |
Similar Demographics by Male Poverty
Demographics Similar to Senegalese by Male Poverty
In terms of male poverty, the demographic groups most similar to Senegalese are Bahamian (14.1%, a difference of 0.10%), Immigrants from Caribbean (14.0%, a difference of 0.14%), Immigrants from Senegal (14.0%, a difference of 0.20%), Immigrants from Bangladesh (14.1%, a difference of 0.21%), and Immigrants from Mexico (14.0%, a difference of 0.27%).
| Demographics | Rating | Rank | Male Poverty |
| Inupiat | 0.0 /100 | #297 | Tragic 14.0% |
| Blackfeet | 0.0 /100 | #298 | Tragic 14.0% |
| Immigrants | Guatemala | 0.0 /100 | #299 | Tragic 14.0% |
| Immigrants | Mexico | 0.0 /100 | #300 | Tragic 14.0% |
| Immigrants | Senegal | 0.0 /100 | #301 | Tragic 14.0% |
| Immigrants | Caribbean | 0.0 /100 | #302 | Tragic 14.0% |
| Bahamians | 0.0 /100 | #303 | Tragic 14.1% |
| Senegalese | 0.0 /100 | #304 | Tragic 14.1% |
| Immigrants | Bangladesh | 0.0 /100 | #305 | Tragic 14.1% |
| Creek | 0.0 /100 | #306 | Tragic 14.1% |
| Dutch West Indians | 0.0 /100 | #307 | Tragic 14.2% |
| Africans | 0.0 /100 | #308 | Tragic 14.2% |
| Somalis | 0.0 /100 | #309 | Tragic 14.3% |
| Seminole | 0.0 /100 | #310 | Tragic 14.3% |
| Hondurans | 0.0 /100 | #311 | Tragic 14.3% |
Demographics Similar to Native Hawaiians by Male Poverty
In terms of male poverty, the demographic groups most similar to Native Hawaiians are Peruvian (10.7%, a difference of 0.020%), Immigrants from China (10.7%, a difference of 0.030%), South African (10.7%, a difference of 0.040%), French (10.7%, a difference of 0.070%), and Immigrants from Hungary (10.7%, a difference of 0.13%).
| Demographics | Rating | Rank | Male Poverty |
| Immigrants | Russia | 88.6 /100 | #115 | Excellent 10.6% |
| Sri Lankans | 88.1 /100 | #116 | Excellent 10.6% |
| Immigrants | South Eastern Asia | 88.1 /100 | #117 | Excellent 10.6% |
| Okinawans | 87.6 /100 | #118 | Excellent 10.7% |
| Immigrants | Hungary | 87.6 /100 | #119 | Excellent 10.7% |
| Immigrants | China | 87.1 /100 | #120 | Excellent 10.7% |
| Peruvians | 87.1 /100 | #121 | Excellent 10.7% |
| Native Hawaiians | 87.0 /100 | #122 | Excellent 10.7% |
| South Africans | 86.8 /100 | #123 | Excellent 10.7% |
| French | 86.7 /100 | #124 | Excellent 10.7% |
| Immigrants | Norway | 86.0 /100 | #125 | Excellent 10.7% |
| Immigrants | Ukraine | 84.3 /100 | #126 | Excellent 10.7% |
| Puget Sound Salish | 84.3 /100 | #127 | Excellent 10.7% |
| Immigrants | Western Europe | 84.2 /100 | #128 | Excellent 10.7% |
| Immigrants | Peru | 84.1 /100 | #129 | Excellent 10.7% |