Senegalese vs Immigrants from Lithuania Single Father Poverty
COMPARE
Senegalese
Immigrants from Lithuania
Single Father Poverty
Single Father Poverty Comparison
Senegalese
Immigrants from Lithuania
16.9%
SINGLE FATHER POVERTY
3.2/ 100
METRIC RATING
233rd/ 347
METRIC RANK
15.3%
SINGLE FATHER POVERTY
99.6/ 100
METRIC RATING
72nd/ 347
METRIC RANK
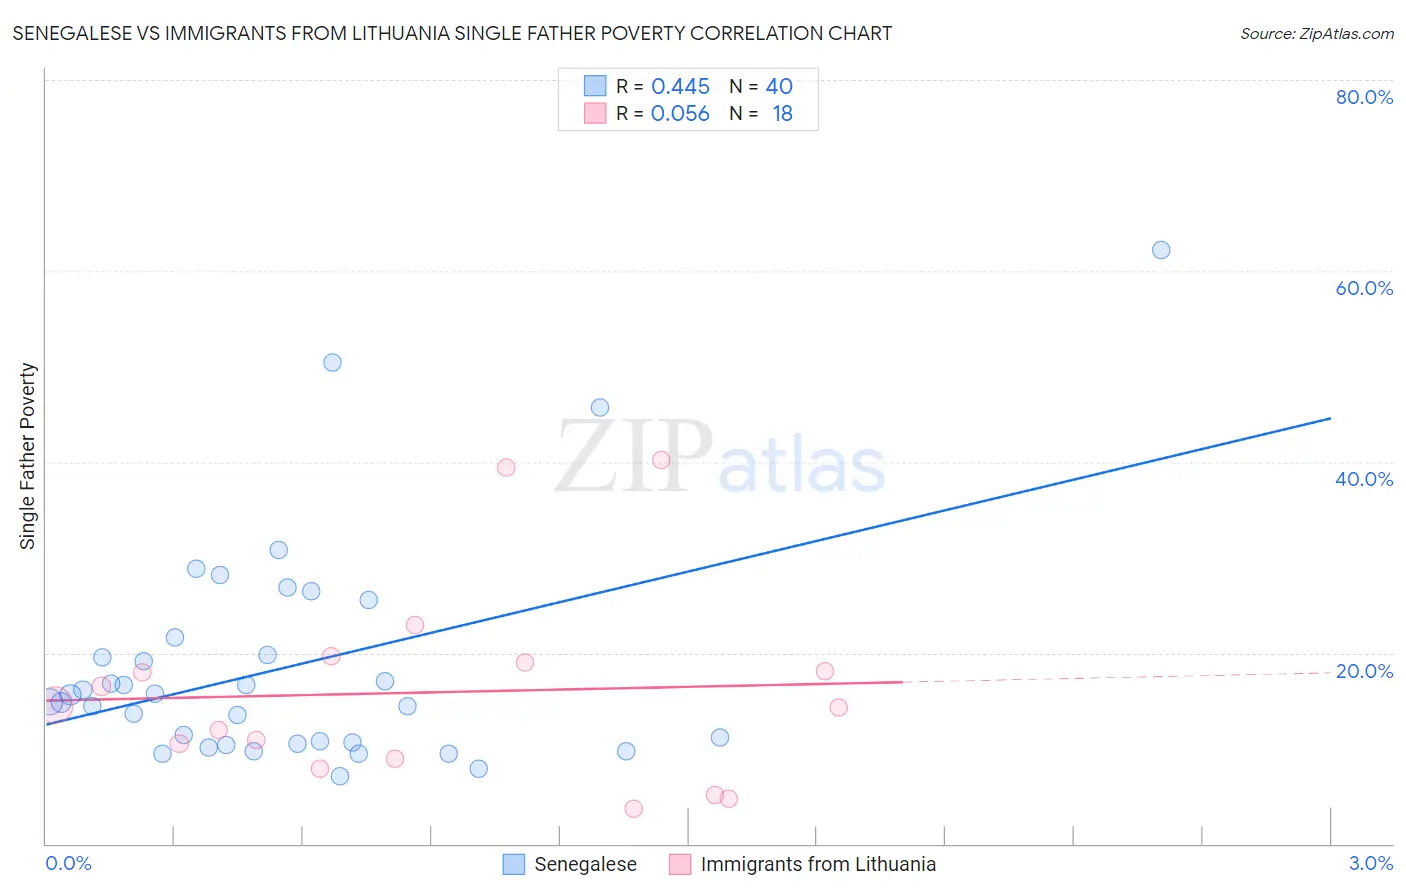
Senegalese vs Immigrants from Lithuania Single Father Poverty Correlation Chart
The statistical analysis conducted on geographies consisting of 73,350,667 people shows a moderate positive correlation between the proportion of Senegalese and poverty level among single fathers in the United States with a correlation coefficient (R) of 0.445 and weighted average of 16.9%. Similarly, the statistical analysis conducted on geographies consisting of 100,005,444 people shows a slight positive correlation between the proportion of Immigrants from Lithuania and poverty level among single fathers in the United States with a correlation coefficient (R) of 0.056 and weighted average of 15.3%, a difference of 10.5%.
Single Father Poverty Correlation Summary
| Measurement | Senegalese | Immigrants from Lithuania |
| Minimum | 7.1% | 3.6% |
| Maximum | 62.2% | 40.2% |
| Range | 55.1% | 36.6% |
| Mean | 18.6% | 15.9% |
| Median | 15.2% | 14.4% |
| Interquartile 25% (IQ1) | 10.5% | 8.9% |
| Interquartile 75% (IQ3) | 20.7% | 18.9% |
| Interquartile Range (IQR) | 10.1% | 10.1% |
| Standard Deviation (Sample) | 11.8% | 10.3% |
| Standard Deviation (Population) | 11.7% | 10.0% |
Similar Demographics by Single Father Poverty
Demographics Similar to Senegalese by Single Father Poverty
In terms of single father poverty, the demographic groups most similar to Senegalese are Marshallese (16.9%, a difference of 0.030%), Immigrants from Western Europe (16.9%, a difference of 0.12%), Immigrants from Germany (16.9%, a difference of 0.12%), Subsaharan African (16.9%, a difference of 0.13%), and Immigrants from Grenada (16.9%, a difference of 0.14%).
| Demographics | Rating | Rank | Single Father Poverty |
| Hispanics or Latinos | 6.1 /100 | #226 | Tragic 16.8% |
| British | 5.6 /100 | #227 | Tragic 16.8% |
| Belgians | 5.3 /100 | #228 | Tragic 16.8% |
| Israelis | 4.6 /100 | #229 | Tragic 16.8% |
| Immigrants | Trinidad and Tobago | 4.5 /100 | #230 | Tragic 16.8% |
| Spanish Americans | 3.7 /100 | #231 | Tragic 16.9% |
| Immigrants | Grenada | 3.7 /100 | #232 | Tragic 16.9% |
| Senegalese | 3.2 /100 | #233 | Tragic 16.9% |
| Marshallese | 3.1 /100 | #234 | Tragic 16.9% |
| Immigrants | Western Europe | 2.9 /100 | #235 | Tragic 16.9% |
| Immigrants | Germany | 2.9 /100 | #236 | Tragic 16.9% |
| Sub-Saharan Africans | 2.9 /100 | #237 | Tragic 16.9% |
| Immigrants | Saudi Arabia | 2.7 /100 | #238 | Tragic 16.9% |
| Bermudans | 2.6 /100 | #239 | Tragic 16.9% |
| Finns | 2.6 /100 | #240 | Tragic 16.9% |
Demographics Similar to Immigrants from Lithuania by Single Father Poverty
In terms of single father poverty, the demographic groups most similar to Immigrants from Lithuania are Kenyan (15.3%, a difference of 0.090%), Immigrants from Brazil (15.3%, a difference of 0.12%), Maltese (15.3%, a difference of 0.13%), Immigrants from Turkey (15.3%, a difference of 0.15%), and Immigrants from Japan (15.3%, a difference of 0.23%).
| Demographics | Rating | Rank | Single Father Poverty |
| Immigrants | Malaysia | 99.8 /100 | #65 | Exceptional 15.2% |
| Immigrants | Moldova | 99.8 /100 | #66 | Exceptional 15.2% |
| Paraguayans | 99.7 /100 | #67 | Exceptional 15.2% |
| Immigrants | Cameroon | 99.7 /100 | #68 | Exceptional 15.2% |
| Japanese | 99.7 /100 | #69 | Exceptional 15.2% |
| Mongolians | 99.7 /100 | #70 | Exceptional 15.3% |
| Immigrants | Brazil | 99.6 /100 | #71 | Exceptional 15.3% |
| Immigrants | Lithuania | 99.6 /100 | #72 | Exceptional 15.3% |
| Kenyans | 99.6 /100 | #73 | Exceptional 15.3% |
| Maltese | 99.6 /100 | #74 | Exceptional 15.3% |
| Immigrants | Turkey | 99.5 /100 | #75 | Exceptional 15.3% |
| Immigrants | Japan | 99.5 /100 | #76 | Exceptional 15.3% |
| Immigrants | Peru | 99.5 /100 | #77 | Exceptional 15.3% |
| Tlingit-Haida | 99.5 /100 | #78 | Exceptional 15.3% |
| Immigrants | Northern Africa | 99.5 /100 | #79 | Exceptional 15.3% |