Scottish vs Yup'ik Child Poverty Among Boys Under 16
COMPARE
Scottish
Yup'ik
Child Poverty Among Boys Under 16
Child Poverty Among Boys Under 16 Comparison
Scottish
Yup'ik
15.2%
CHILD POVERTY AMONG BOYS UNDER 16
93.0/ 100
METRIC RATING
121st/ 347
METRIC RANK
24.7%
CHILD POVERTY AMONG BOYS UNDER 16
0.0/ 100
METRIC RATING
335th/ 347
METRIC RANK
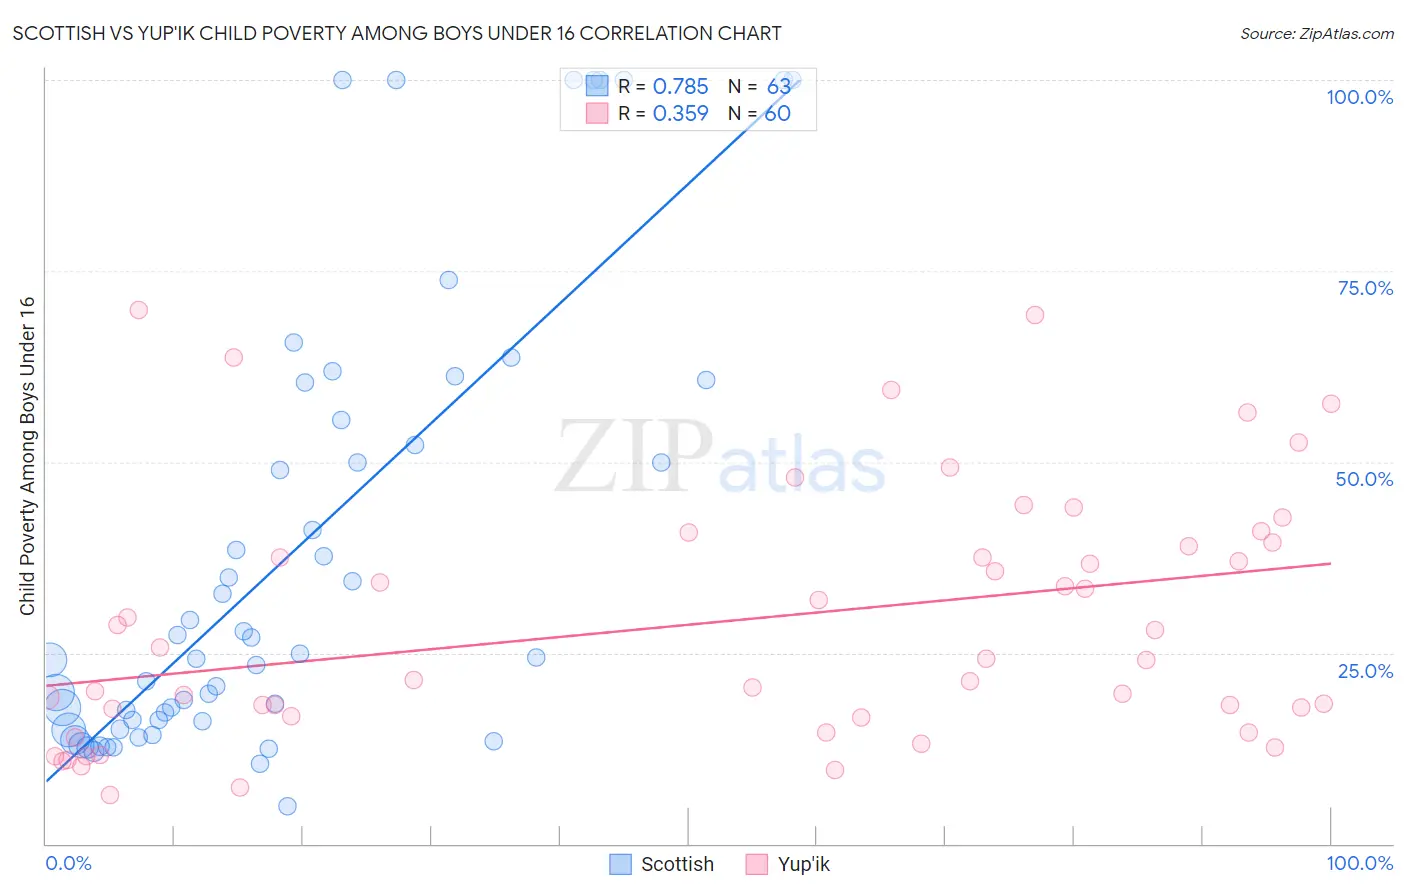
Scottish vs Yup'ik Child Poverty Among Boys Under 16 Correlation Chart
The statistical analysis conducted on geographies consisting of 546,371,305 people shows a strong positive correlation between the proportion of Scottish and poverty level among boys under the age of 16 in the United States with a correlation coefficient (R) of 0.785 and weighted average of 15.2%. Similarly, the statistical analysis conducted on geographies consisting of 39,797,465 people shows a mild positive correlation between the proportion of Yup'ik and poverty level among boys under the age of 16 in the United States with a correlation coefficient (R) of 0.359 and weighted average of 24.7%, a difference of 62.2%.
Child Poverty Among Boys Under 16 Correlation Summary
| Measurement | Scottish | Yup'ik |
| Minimum | 5.0% | 6.4% |
| Maximum | 100.0% | 69.9% |
| Range | 95.0% | 63.5% |
| Mean | 37.8% | 28.9% |
| Median | 24.3% | 24.1% |
| Interquartile 25% (IQ1) | 16.0% | 16.6% |
| Interquartile 75% (IQ3) | 55.6% | 39.2% |
| Interquartile Range (IQR) | 39.5% | 22.6% |
| Standard Deviation (Sample) | 29.2% | 16.4% |
| Standard Deviation (Population) | 29.0% | 16.3% |
Similar Demographics by Child Poverty Among Boys Under 16
Demographics Similar to Scottish by Child Poverty Among Boys Under 16
In terms of child poverty among boys under 16, the demographic groups most similar to Scottish are South African (15.2%, a difference of 0.010%), Belgian (15.2%, a difference of 0.060%), Immigrants from Malaysia (15.3%, a difference of 0.10%), Native Hawaiian (15.2%, a difference of 0.18%), and Immigrants from Vietnam (15.2%, a difference of 0.24%).
| Demographics | Rating | Rank | Child Poverty Among Boys Under 16 |
| Immigrants | Ukraine | 93.6 /100 | #114 | Exceptional 15.2% |
| Armenians | 93.6 /100 | #115 | Exceptional 15.2% |
| Immigrants | South Eastern Asia | 93.5 /100 | #116 | Exceptional 15.2% |
| Immigrants | Vietnam | 93.5 /100 | #117 | Exceptional 15.2% |
| Native Hawaiians | 93.4 /100 | #118 | Exceptional 15.2% |
| Belgians | 93.1 /100 | #119 | Exceptional 15.2% |
| South Africans | 93.0 /100 | #120 | Exceptional 15.2% |
| Scottish | 93.0 /100 | #121 | Exceptional 15.2% |
| Immigrants | Malaysia | 92.8 /100 | #122 | Exceptional 15.3% |
| Immigrants | Norway | 92.3 /100 | #123 | Exceptional 15.3% |
| Tlingit-Haida | 92.2 /100 | #124 | Exceptional 15.3% |
| Czechoslovakians | 92.1 /100 | #125 | Exceptional 15.3% |
| Palestinians | 91.3 /100 | #126 | Exceptional 15.4% |
| Carpatho Rusyns | 91.1 /100 | #127 | Exceptional 15.4% |
| Canadians | 90.6 /100 | #128 | Exceptional 15.4% |
Demographics Similar to Yup'ik by Child Poverty Among Boys Under 16
In terms of child poverty among boys under 16, the demographic groups most similar to Yup'ik are Black/African American (24.5%, a difference of 0.85%), Apache (24.5%, a difference of 0.97%), Immigrants from Dominican Republic (24.3%, a difference of 1.7%), Dominican (24.2%, a difference of 2.3%), and Sioux (25.3%, a difference of 2.3%).
| Demographics | Rating | Rank | Child Poverty Among Boys Under 16 |
| Pueblo | 0.0 /100 | #328 | Tragic 23.5% |
| Natives/Alaskans | 0.0 /100 | #329 | Tragic 24.0% |
| Colville | 0.0 /100 | #330 | Tragic 24.1% |
| Dominicans | 0.0 /100 | #331 | Tragic 24.2% |
| Immigrants | Dominican Republic | 0.0 /100 | #332 | Tragic 24.3% |
| Apache | 0.0 /100 | #333 | Tragic 24.5% |
| Blacks/African Americans | 0.0 /100 | #334 | Tragic 24.5% |
| Yup'ik | 0.0 /100 | #335 | Tragic 24.7% |
| Sioux | 0.0 /100 | #336 | Tragic 25.3% |
| Cheyenne | 0.0 /100 | #337 | Tragic 25.8% |
| Hopi | 0.0 /100 | #338 | Tragic 25.9% |
| Houma | 0.0 /100 | #339 | Tragic 26.2% |
| Crow | 0.0 /100 | #340 | Tragic 26.3% |
| Immigrants | Yemen | 0.0 /100 | #341 | Tragic 28.9% |
| Pima | 0.0 /100 | #342 | Tragic 29.7% |