Scottish vs Immigrants from the Azores Female Poverty Among 18-24 Year Olds

COMPARE

Scottish
Race
Ancestry
AfghanAfricanAlaska NativeAlaskan AthabascanAlbanianAleutAlsatianAmericanApacheArabArapahoArgentineanArmenianAssyrian/Chaldean/SyriacAustralianAustrianBahamianBangladeshiBarbadianBasqueBelgianBelizeanBermudanBhutaneseBlackfeetBolivianBrazilianBritishBritish West IndianBulgarianBurmeseCajunCambodianCanadianCape VerdeanCarpatho RusynCelticCentral AmericanCentral American IndianCherokeeCheyenneChickasawChileanChineseChippewaChoctawColombianColvilleComancheCosta RicanCreeCreekCroatianCrowCubanCypriotCzechCzechoslovakianDanishDelawareDominicanDutchDutch West IndianEastern EuropeanEcuadorianEgyptianEnglishEstonianEthiopianEuropeanFijianFilipinoFinnishFrenchFrench American IndianFrench CanadianGermanGerman RussianGhanaianGreekGuamanian/ChamorroGuatemalanGuyaneseHaitianHmongHonduranHopiHoumaHungarianIcelanderIndian (Asian)IndonesianInupiatIranianIraqiIrishIroquoisIsraeliItalianJamaicanJapaneseJordanianKenyanKiowaKoreanLaotianLatvianLebaneseLiberianLithuanianLumbeeLuxembourgerMacedonianMalaysianMalteseMarshalleseMenomineeMexicanMexican American IndianMongolianMoroccanNative HawaiianNavajoNepaleseNew ZealanderNicaraguanNigerianNorthern EuropeanNorwegianOkinawanOsageOttawaPaiutePakistaniPalestinianPanamanianParaguayanPennsylvania GermanPeruvianPimaPolishPortuguesePotawatomiPuebloPuerto RicanPuget Sound SalishRomanianRussianSalvadoranSamoanScandinavianScotch-IrishScottishSeminoleSenegaleseSerbianShoshoneSierra LeoneanSiouxSlavicSlovakSloveneSomaliSouth AfricanSouth AmericanSouth American IndianSoviet UnionSpaniardSpanishSpanish AmericanSpanish American IndianSri LankanSubsaharan AfricanSudaneseSwedishSwissSyrianTaiwaneseThaiTlingit-HaidaTohono O'OdhamTonganTrinidadian and TobagonianTsimshianTurkishU.S. Virgin IslanderUgandanUkrainianUruguayanUteVenezuelanVietnameseWelshWest IndianYakamaYaquiYugoslavianYumanYup'ikZimbabwean
Immigration
NonimmigrantsImmigrantsAfghanistanAfricaAlbaniaArgentinaArmeniaAsiaAustraliaAustriaBahamasBangladeshBarbadosBelarusBelgiumBelizeBoliviaBosnia and HerzegovinaBrazilBulgariaBurma/MyanmarCabo VerdeCambodiaCameroonCanadaCaribbeanCentral AmericaChileChinaColombiaCongoCosta RicaCroatiaCubaCzechoslovakiaDenmarkDominicaDominican RepublicEastern AfricaEastern AsiaEastern EuropeEcuadorEgyptEl SalvadorEnglandEritreaEthiopiaEuropeFijiFranceGermanyGhanaGreeceGrenadaGuatemalaGuyanaHaitiHondurasHong KongHungaryIndiaIndonesiaIranIraqIrelandIsraelItalyJamaicaJapanJordanKazakhstanKenyaKoreaKuwaitLaosLatin AmericaLatviaLebanonLiberiaLithuaniaMalaysiaMexicoMicronesiaMiddle AfricaMoldovaMoroccoNepalNetherlandsNicaraguaNigeriaNorth AmericaNorth MacedoniaNorthern AfricaNorthern EuropeNorwayOceaniaPakistanPanamaPeruPhilippinesPolandPortugalRomaniaRussiaSaudi ArabiaScotlandSenegalSerbiaSierra LeoneSingaporeSomaliaSouth AfricaSouth AmericaSouth Central AsiaSouth Eastern AsiaSouthern EuropeSpainSri LankaSt. Vincent and the GrenadinesSudanSwedenSwitzerlandSyriaTaiwanThailandTrinidad and TobagoTurkeyUgandaUkraineUruguayUzbekistanVenezuelaVietnamWest IndiesWestern AfricaWestern AsiaWestern EuropeYemenZaireZimbabwe
Immigrants from the Azores
Race
Ancestry
AfghanAfricanAlaska NativeAlaskan AthabascanAlbanianAleutAlsatianAmericanApacheArabArapahoArgentineanArmenianAssyrian/Chaldean/SyriacAustralianAustrianBahamianBangladeshiBarbadianBasqueBelgianBelizeanBermudanBhutaneseBlackfeetBolivianBrazilianBritishBritish West IndianBulgarianBurmeseCajunCambodianCanadianCape VerdeanCarpatho RusynCelticCentral AmericanCentral American IndianCherokeeCheyenneChickasawChileanChineseChippewaChoctawColombianColvilleComancheCosta RicanCreeCreekCroatianCrowCubanCypriotCzechCzechoslovakianDanishDelawareDominicanDutchDutch West IndianEastern EuropeanEcuadorianEgyptianEnglishEstonianEthiopianEuropeanFijianFilipinoFinnishFrenchFrench American IndianFrench CanadianGermanGerman RussianGhanaianGreekGuamanian/ChamorroGuatemalanGuyaneseHaitianHmongHonduranHopiHoumaHungarianIcelanderIndian (Asian)IndonesianInupiatIranianIraqiIrishIroquoisIsraeliItalianJamaicanJapaneseJordanianKenyanKiowaKoreanLaotianLatvianLebaneseLiberianLithuanianLumbeeLuxembourgerMacedonianMalaysianMalteseMarshalleseMenomineeMexicanMexican American IndianMongolianMoroccanNative HawaiianNavajoNepaleseNew ZealanderNicaraguanNigerianNorthern EuropeanNorwegianOkinawanOsageOttawaPaiutePakistaniPalestinianPanamanianParaguayanPennsylvania GermanPeruvianPimaPolishPortuguesePotawatomiPuebloPuerto RicanPuget Sound SalishRomanianRussianSalvadoranSamoanScandinavianScotch-IrishSeminoleSenegaleseSerbianShoshoneSierra LeoneanSiouxSlavicSlovakSloveneSomaliSouth AfricanSouth AmericanSouth American IndianSoviet UnionSpaniardSpanishSpanish AmericanSpanish American IndianSri LankanSubsaharan AfricanSudaneseSwedishSwissSyrianTaiwaneseThaiTlingit-HaidaTohono O'OdhamTonganTrinidadian and TobagonianTsimshianTurkishU.S. Virgin IslanderUgandanUkrainianUruguayanUteVenezuelanVietnameseWelshWest IndianYakamaYaquiYugoslavianYumanYup'ikZimbabwean
Immigration
NonimmigrantsImmigrantsAfghanistanAfricaAlbaniaArgentinaArmeniaAsiaAustraliaAustriaBahamasBangladeshBarbadosBelarusBelgiumBelizeBoliviaBosnia and HerzegovinaBrazilBulgariaBurma/MyanmarCabo VerdeCambodiaCameroonCanadaCaribbeanCentral AmericaChileChinaColombiaCongoCosta RicaCroatiaCubaCzechoslovakiaDenmarkDominicaDominican RepublicEastern AfricaEastern AsiaEastern EuropeEcuadorEgyptEl SalvadorEnglandEritreaEthiopiaEuropeFijiFranceGermanyGhanaGreeceGrenadaGuatemalaGuyanaHaitiHondurasHong KongHungaryIndiaIndonesiaIranIraqIrelandIsraelItalyJamaicaJapanJordanKazakhstanKenyaKoreaKuwaitLaosLatin AmericaLatviaLebanonLiberiaLithuaniaMalaysiaMexicoMicronesiaMiddle AfricaMoldovaMoroccoNepalNetherlandsNicaraguaNigeriaNorth AmericaNorth MacedoniaNorthern AfricaNorthern EuropeNorwayOceaniaPakistanPanamaPeruPhilippinesPolandPortugalRomaniaRussiaSaudi ArabiaScotlandSenegalSerbiaSierra LeoneSingaporeSomaliaSouth AfricaSouth AmericaSouth Central AsiaSouth Eastern AsiaSouthern EuropeSpainSri LankaSt. Vincent and the GrenadinesSudanSwedenSwitzerlandSyriaTaiwanThailandTrinidad and TobagoTurkeyUgandaUkraineUruguayUzbekistanVenezuelaVietnamWest IndiesWestern AfricaWestern AsiaWestern EuropeYemenZaireZimbabweAzores
Female Poverty Among 18-24 Year Olds
Income
Poverty
Unemployment
Labor Participation
Family Structure
Vehicle Availability
Education Level
Disability

Female Poverty Among 18-24 Year Olds Comparison

Scottish

Immigrants from the Azores

Tragic
Exceptional
20.9%
FEMALE POVERTY AMONG 18-24 YEAR OLDS
4.5/ 100
METRIC RATING
237th/ 347
METRIC RANK
16.7%
FEMALE POVERTY AMONG 18-24 YEAR OLDS
100.0/ 100
METRIC RATING
7th/ 347
METRIC RANK

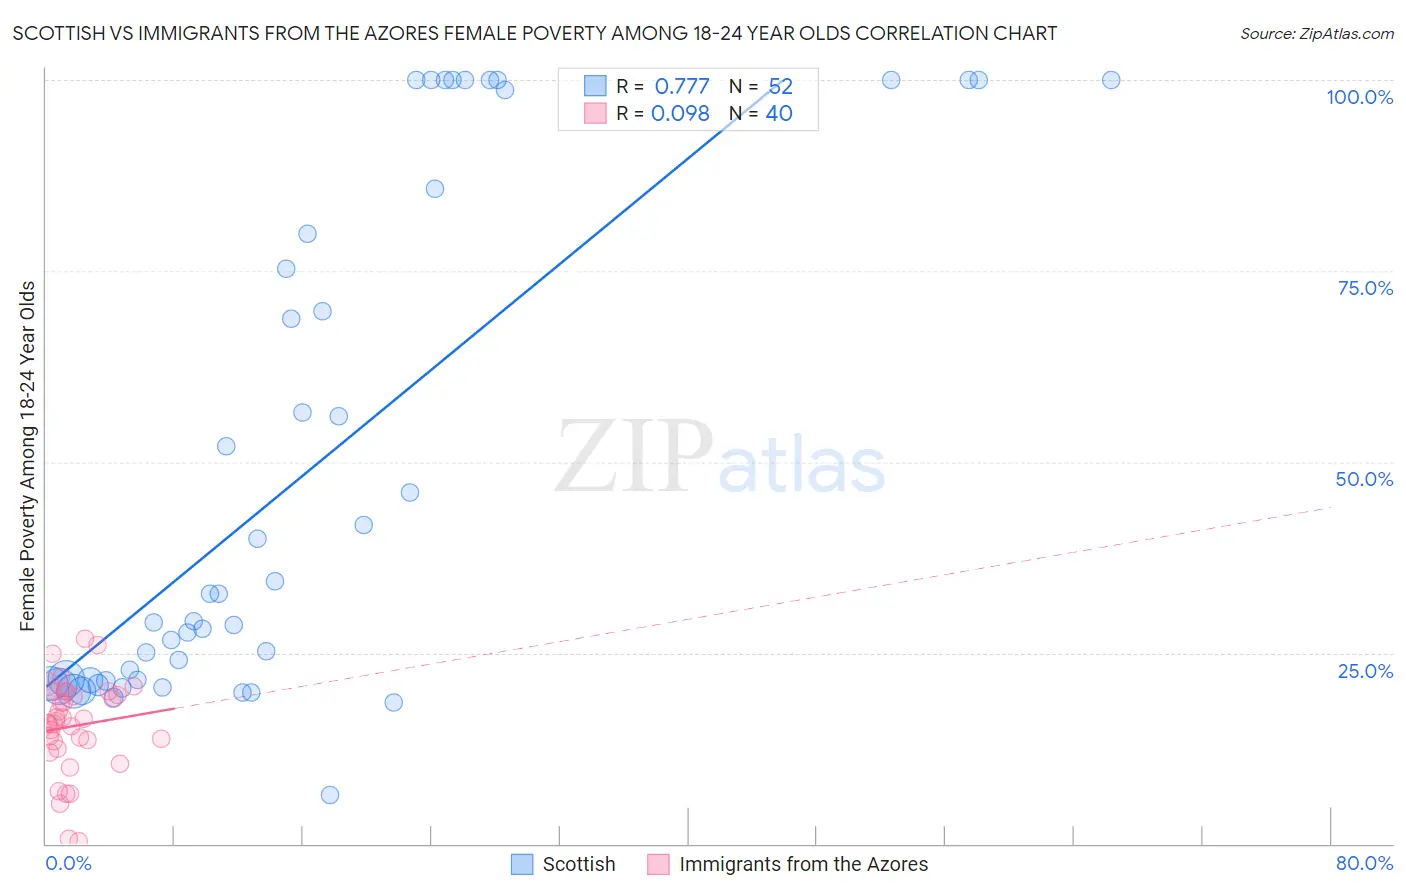
Scottish vs Immigrants from the Azores Female Poverty Among 18-24 Year Olds Correlation Chart

The statistical analysis conducted on geographies consisting of 532,782,513 people shows a strong positive correlation between the proportion of Scottish and poverty level among females between the ages 18 and 24 in the United States with a correlation coefficient (R) of 0.777 and weighted average of 20.9%. Similarly, the statistical analysis conducted on geographies consisting of 45,673,752 people shows a slight positive correlation between the proportion of Immigrants from the Azores and poverty level among females between the ages 18 and 24 in the United States with a correlation coefficient (R) of 0.098 and weighted average of 16.7%, a difference of 25.0%.
Scottish vs Immigrants from the Azores Female Poverty Among 18-24 Year Olds

Female Poverty Among 18-24 Year Olds Correlation Summary

MeasurementScottishImmigrants from the Azores
Minimum6.3%0.25%
Maximum100.0%26.8%
Range93.7%26.6%
Mean49.0%15.4%
Median30.9%15.9%
Interquartile 25% (IQ1)21.4%12.9%
Interquartile 75% (IQ3)82.8%19.7%
Interquartile Range (IQR)61.4%6.8%
Standard Deviation (Sample)32.8%6.1%
Standard Deviation (Population)32.5%6.0%

Similar Demographics by Female Poverty Among 18-24 Year Olds

Demographics Similar to Scottish by Female Poverty Among 18-24 Year Olds

In terms of female poverty among 18-24 year olds, the demographic groups most similar to Scottish are Immigrants from Singapore (20.9%, a difference of 0.040%), Immigrants from Guatemala (20.9%, a difference of 0.050%), Luxembourger (20.9%, a difference of 0.070%), Immigrants from Eritrea (20.9%, a difference of 0.090%), and Okinawan (20.8%, a difference of 0.10%).
DemographicsRating | RankFemale Poverty Among 18-24 Year Olds
Whites/Caucasians
6.1
/100
|
#230
Tragic
20.8%
Immigrants | St. Vincent and the Grenadines
6.0
/100
|
#231
Tragic
20.8%
Finns
6.0
/100
|
#232
Tragic
20.8%
Immigrants | Denmark
5.8
/100
|
#233
Tragic
20.8%
Welsh
5.4
/100
|
#234
Tragic
20.8%
Immigrants | Uganda
5.1
/100
|
#235
Tragic
20.8%
Okinawans
4.9
/100
|
#236
Tragic
20.8%
Scottish
4.5
/100
|
#237
Tragic
20.9%
Immigrants | Singapore
4.4
/100
|
#238
Tragic
20.9%
Immigrants | Guatemala
4.3
/100
|
#239
Tragic
20.9%
Luxembourgers
4.2
/100
|
#240
Tragic
20.9%
Immigrants | Eritrea
4.2
/100
|
#241
Tragic
20.9%
Israelis
4.1
/100
|
#242
Tragic
20.9%
Marshallese
3.4
/100
|
#243
Tragic
20.9%
Immigrants | Thailand
3.4
/100
|
#244
Tragic
20.9%

Demographics Similar to Immigrants from the Azores by Female Poverty Among 18-24 Year Olds

In terms of female poverty among 18-24 year olds, the demographic groups most similar to Immigrants from the Azores are Immigrants from Philippines (16.7%, a difference of 0.060%), Immigrants from Bolivia (16.7%, a difference of 0.29%), Immigrants from Portugal (16.5%, a difference of 0.80%), Immigrants from Peru (16.9%, a difference of 1.1%), and Korean (16.9%, a difference of 1.5%).
DemographicsRating | RankFemale Poverty Among 18-24 Year Olds
Assyrians/Chaldeans/Syriacs
100.0
/100
|
#1
Exceptional
13.7%
Chinese
100.0
/100
|
#2
Exceptional
16.2%
Immigrants | Cuba
100.0
/100
|
#3
Exceptional
16.4%
Immigrants | India
100.0
/100
|
#4
Exceptional
16.4%
Immigrants | Portugal
100.0
/100
|
#5
Exceptional
16.5%
Immigrants | Philippines
100.0
/100
|
#6
Exceptional
16.7%
Immigrants | Azores
100.0
/100
|
#7
Exceptional
16.7%
Immigrants | Bolivia
100.0
/100
|
#8
Exceptional
16.7%
Immigrants | Peru
100.0
/100
|
#9
Exceptional
16.9%
Koreans
100.0
/100
|
#10
Exceptional
16.9%
Thais
100.0
/100
|
#11
Exceptional
17.0%
Immigrants | Pakistan
100.0
/100
|
#12
Exceptional
17.0%
Immigrants | Poland
100.0
/100
|
#13
Exceptional
17.1%
Tongans
100.0
/100
|
#14
Exceptional
17.1%
Cubans
100.0
/100
|
#15
Exceptional
17.2%