Scotch-Irish vs Nepalese Family Poverty
COMPARE
Scotch-Irish
Nepalese
Family Poverty
Family Poverty Comparison
Scotch-Irish
Nepalese
8.6%
FAMILY POVERTY
82.2/ 100
METRIC RATING
148th/ 347
METRIC RANK
10.4%
FAMILY POVERTY
0.8/ 100
METRIC RATING
243rd/ 347
METRIC RANK
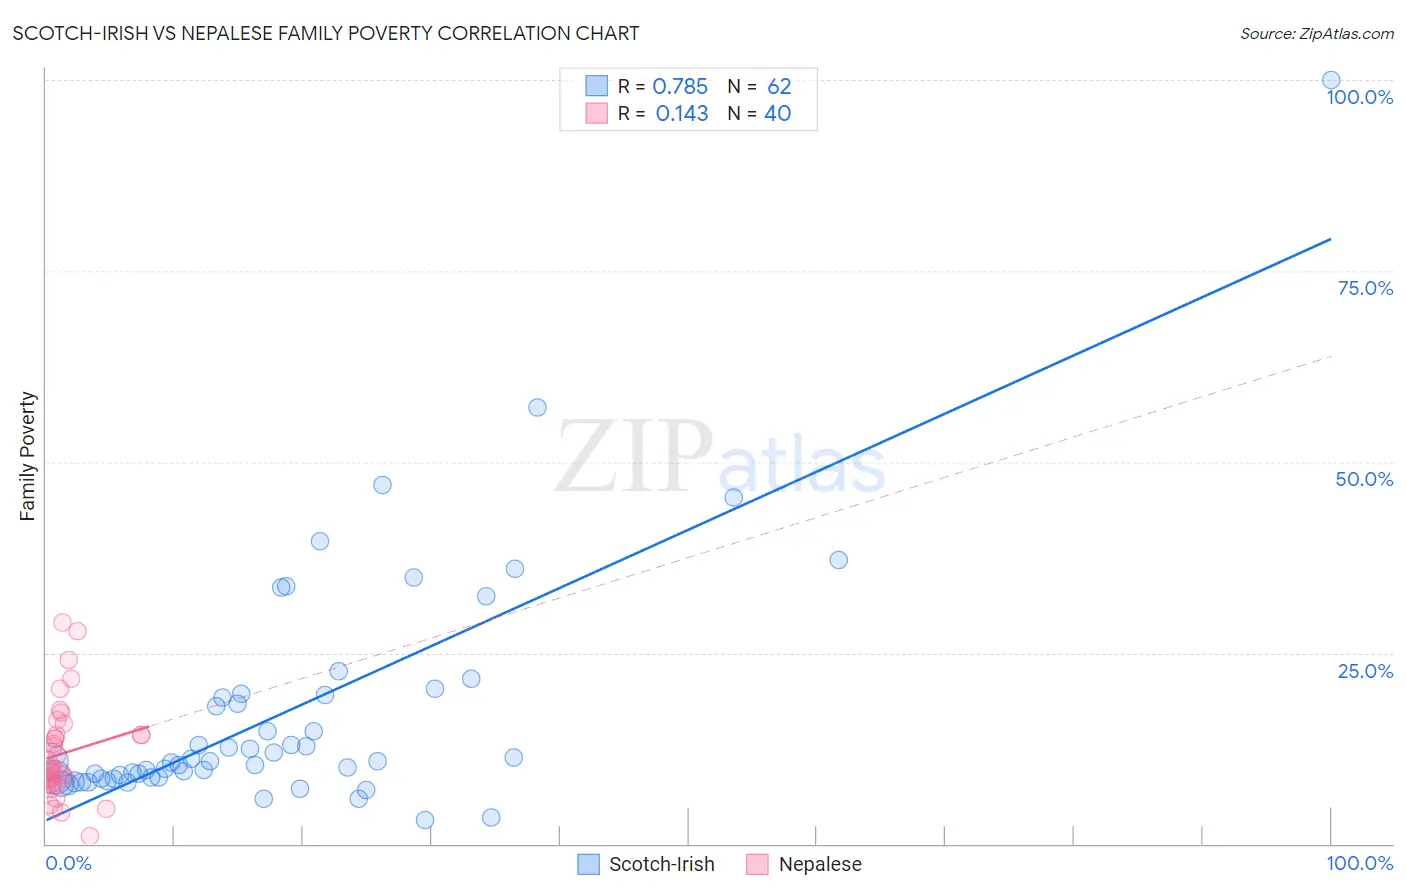
Scotch-Irish vs Nepalese Family Poverty Correlation Chart
The statistical analysis conducted on geographies consisting of 545,166,810 people shows a strong positive correlation between the proportion of Scotch-Irish and poverty level among families in the United States with a correlation coefficient (R) of 0.785 and weighted average of 8.6%. Similarly, the statistical analysis conducted on geographies consisting of 24,521,755 people shows a poor positive correlation between the proportion of Nepalese and poverty level among families in the United States with a correlation coefficient (R) of 0.143 and weighted average of 10.4%, a difference of 21.8%.
Family Poverty Correlation Summary
| Measurement | Scotch-Irish | Nepalese |
| Minimum | 3.0% | 0.90% |
| Maximum | 100.0% | 28.9% |
| Range | 97.0% | 28.0% |
| Mean | 17.2% | 11.8% |
| Median | 10.8% | 9.7% |
| Interquartile 25% (IQ1) | 8.6% | 8.1% |
| Interquartile 75% (IQ3) | 19.4% | 14.2% |
| Interquartile Range (IQR) | 10.8% | 6.1% |
| Standard Deviation (Sample) | 15.9% | 6.2% |
| Standard Deviation (Population) | 15.7% | 6.2% |
Similar Demographics by Family Poverty
Demographics Similar to Scotch-Irish by Family Poverty
In terms of family poverty, the demographic groups most similar to Scotch-Irish are Immigrants from Jordan (8.5%, a difference of 0.21%), Immigrants from Belarus (8.5%, a difference of 0.24%), Immigrants from South Eastern Asia (8.5%, a difference of 0.25%), Albanian (8.5%, a difference of 0.27%), and Immigrants from Germany (8.5%, a difference of 0.29%).
| Demographics | Rating | Rank | Family Poverty |
| Immigrants | Ukraine | 83.9 /100 | #141 | Excellent 8.5% |
| Yugoslavians | 83.5 /100 | #142 | Excellent 8.5% |
| Immigrants | Germany | 83.3 /100 | #143 | Excellent 8.5% |
| Albanians | 83.3 /100 | #144 | Excellent 8.5% |
| Immigrants | South Eastern Asia | 83.2 /100 | #145 | Excellent 8.5% |
| Immigrants | Belarus | 83.2 /100 | #146 | Excellent 8.5% |
| Immigrants | Jordan | 83.0 /100 | #147 | Excellent 8.5% |
| Scotch-Irish | 82.2 /100 | #148 | Excellent 8.6% |
| Mongolians | 80.4 /100 | #149 | Excellent 8.6% |
| Syrians | 80.3 /100 | #150 | Excellent 8.6% |
| Brazilians | 80.1 /100 | #151 | Excellent 8.6% |
| Samoans | 79.8 /100 | #152 | Good 8.6% |
| Immigrants | Spain | 79.1 /100 | #153 | Good 8.6% |
| Immigrants | Vietnam | 75.4 /100 | #154 | Good 8.7% |
| Immigrants | Kuwait | 73.6 /100 | #155 | Good 8.7% |
Demographics Similar to Nepalese by Family Poverty
In terms of family poverty, the demographic groups most similar to Nepalese are Cree (10.5%, a difference of 0.46%), Alaska Native (10.4%, a difference of 0.48%), Immigrants from Burma/Myanmar (10.5%, a difference of 1.1%), Ghanaian (10.3%, a difference of 1.3%), and Immigrants from the Azores (10.3%, a difference of 1.4%).
| Demographics | Rating | Rank | Family Poverty |
| Immigrants | Nigeria | 1.9 /100 | #236 | Tragic 10.2% |
| Immigrants | Laos | 1.7 /100 | #237 | Tragic 10.2% |
| French American Indians | 1.5 /100 | #238 | Tragic 10.2% |
| Potawatomi | 1.5 /100 | #239 | Tragic 10.2% |
| Immigrants | Azores | 1.4 /100 | #240 | Tragic 10.3% |
| Ghanaians | 1.3 /100 | #241 | Tragic 10.3% |
| Alaska Natives | 1.0 /100 | #242 | Tragic 10.4% |
| Nepalese | 0.8 /100 | #243 | Tragic 10.4% |
| Cree | 0.7 /100 | #244 | Tragic 10.5% |
| Immigrants | Burma/Myanmar | 0.6 /100 | #245 | Tragic 10.5% |
| Cherokee | 0.5 /100 | #246 | Tragic 10.6% |
| Liberians | 0.4 /100 | #247 | Tragic 10.6% |
| Nicaraguans | 0.4 /100 | #248 | Tragic 10.6% |
| Cubans | 0.4 /100 | #249 | Tragic 10.6% |
| Salvadorans | 0.3 /100 | #250 | Tragic 10.7% |