Scotch-Irish vs Cuban Seniors Poverty Over the Age of 65
COMPARE
Scotch-Irish
Cuban
Seniors Poverty Over the Age of 65
Seniors Poverty Over the Age of 65 Comparison
Scotch-Irish
Cubans
9.5%
SENIORS POVERTY OVER THE AGE OF 65
99.7/ 100
METRIC RATING
37th/ 347
METRIC RANK
16.1%
SENIORS POVERTY OVER THE AGE OF 65
0.0/ 100
METRIC RATING
335th/ 347
METRIC RANK
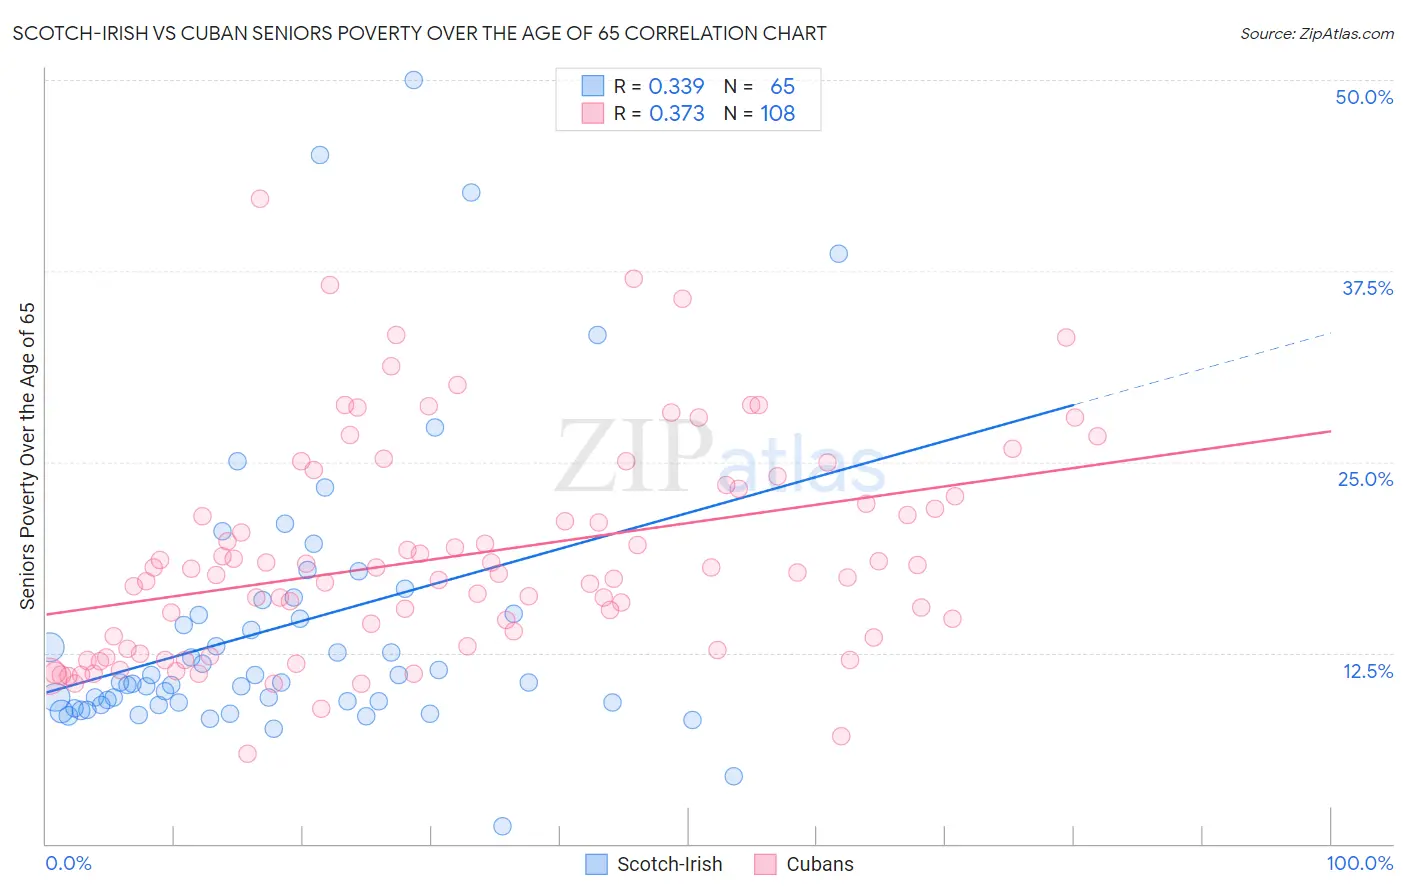
Scotch-Irish vs Cuban Seniors Poverty Over the Age of 65 Correlation Chart
The statistical analysis conducted on geographies consisting of 544,466,236 people shows a mild positive correlation between the proportion of Scotch-Irish and poverty level among seniors over the age of 65 in the United States with a correlation coefficient (R) of 0.339 and weighted average of 9.5%. Similarly, the statistical analysis conducted on geographies consisting of 447,431,553 people shows a mild positive correlation between the proportion of Cubans and poverty level among seniors over the age of 65 in the United States with a correlation coefficient (R) of 0.373 and weighted average of 16.1%, a difference of 69.4%.
Seniors Poverty Over the Age of 65 Correlation Summary
| Measurement | Scotch-Irish | Cuban |
| Minimum | 1.1% | 5.9% |
| Maximum | 50.0% | 42.2% |
| Range | 48.9% | 36.3% |
| Mean | 14.3% | 18.8% |
| Median | 10.5% | 17.7% |
| Interquartile 25% (IQ1) | 9.2% | 12.9% |
| Interquartile 75% (IQ3) | 15.5% | 23.0% |
| Interquartile Range (IQR) | 6.3% | 10.1% |
| Standard Deviation (Sample) | 9.4% | 7.1% |
| Standard Deviation (Population) | 9.3% | 7.1% |
Similar Demographics by Seniors Poverty Over the Age of 65
Demographics Similar to Scotch-Irish by Seniors Poverty Over the Age of 65
In terms of seniors poverty over the age of 65, the demographic groups most similar to Scotch-Irish are Belgian (9.5%, a difference of 0.020%), Czechoslovakian (9.5%, a difference of 0.50%), Latvian (9.5%, a difference of 0.55%), Greek (9.6%, a difference of 0.65%), and Assyrian/Chaldean/Syriac (9.6%, a difference of 0.77%).
| Demographics | Rating | Rank | Seniors Poverty Over the Age of 65 |
| Menominee | 99.8 /100 | #30 | Exceptional 9.4% |
| Finns | 99.8 /100 | #31 | Exceptional 9.4% |
| Northern Europeans | 99.8 /100 | #32 | Exceptional 9.4% |
| Native Hawaiians | 99.8 /100 | #33 | Exceptional 9.4% |
| British | 99.8 /100 | #34 | Exceptional 9.4% |
| Latvians | 99.8 /100 | #35 | Exceptional 9.5% |
| Czechoslovakians | 99.8 /100 | #36 | Exceptional 9.5% |
| Scotch-Irish | 99.7 /100 | #37 | Exceptional 9.5% |
| Belgians | 99.7 /100 | #38 | Exceptional 9.5% |
| Greeks | 99.6 /100 | #39 | Exceptional 9.6% |
| Assyrians/Chaldeans/Syriacs | 99.6 /100 | #40 | Exceptional 9.6% |
| Immigrants | North Macedonia | 99.6 /100 | #41 | Exceptional 9.6% |
| Zimbabweans | 99.6 /100 | #42 | Exceptional 9.6% |
| Eastern Europeans | 99.6 /100 | #43 | Exceptional 9.6% |
| Austrians | 99.5 /100 | #44 | Exceptional 9.6% |
Demographics Similar to Cubans by Seniors Poverty Over the Age of 65
In terms of seniors poverty over the age of 65, the demographic groups most similar to Cubans are Immigrants from Cabo Verde (16.2%, a difference of 0.57%), Immigrants from Nicaragua (15.9%, a difference of 1.3%), Immigrants from Yemen (15.9%, a difference of 1.4%), Immigrants from Grenada (15.8%, a difference of 1.9%), and Immigrants from Caribbean (16.5%, a difference of 2.4%).
| Demographics | Rating | Rank | Seniors Poverty Over the Age of 65 |
| Sioux | 0.0 /100 | #328 | Tragic 15.3% |
| Immigrants | Dominica | 0.0 /100 | #329 | Tragic 15.5% |
| Immigrants | St. Vincent and the Grenadines | 0.0 /100 | #330 | Tragic 15.5% |
| British West Indians | 0.0 /100 | #331 | Tragic 15.6% |
| Immigrants | Grenada | 0.0 /100 | #332 | Tragic 15.8% |
| Immigrants | Yemen | 0.0 /100 | #333 | Tragic 15.9% |
| Immigrants | Nicaragua | 0.0 /100 | #334 | Tragic 15.9% |
| Cubans | 0.0 /100 | #335 | Tragic 16.1% |
| Immigrants | Cabo Verde | 0.0 /100 | #336 | Tragic 16.2% |
| Immigrants | Caribbean | 0.0 /100 | #337 | Tragic 16.5% |
| Pueblo | 0.0 /100 | #338 | Tragic 17.2% |
| Navajo | 0.0 /100 | #339 | Tragic 17.5% |
| Hopi | 0.0 /100 | #340 | Tragic 17.8% |
| Dominicans | 0.0 /100 | #341 | Tragic 17.8% |
| Immigrants | Cuba | 0.0 /100 | #342 | Tragic 17.9% |