Scotch-Irish vs Albanian Single Mother Poverty
COMPARE
Scotch-Irish
Albanian
Single Mother Poverty
Single Mother Poverty Comparison
Scotch-Irish
Albanians
31.5%
SINGLE MOTHER POVERTY
0.1/ 100
METRIC RATING
269th/ 347
METRIC RANK
27.9%
SINGLE MOTHER POVERTY
97.6/ 100
METRIC RATING
94th/ 347
METRIC RANK
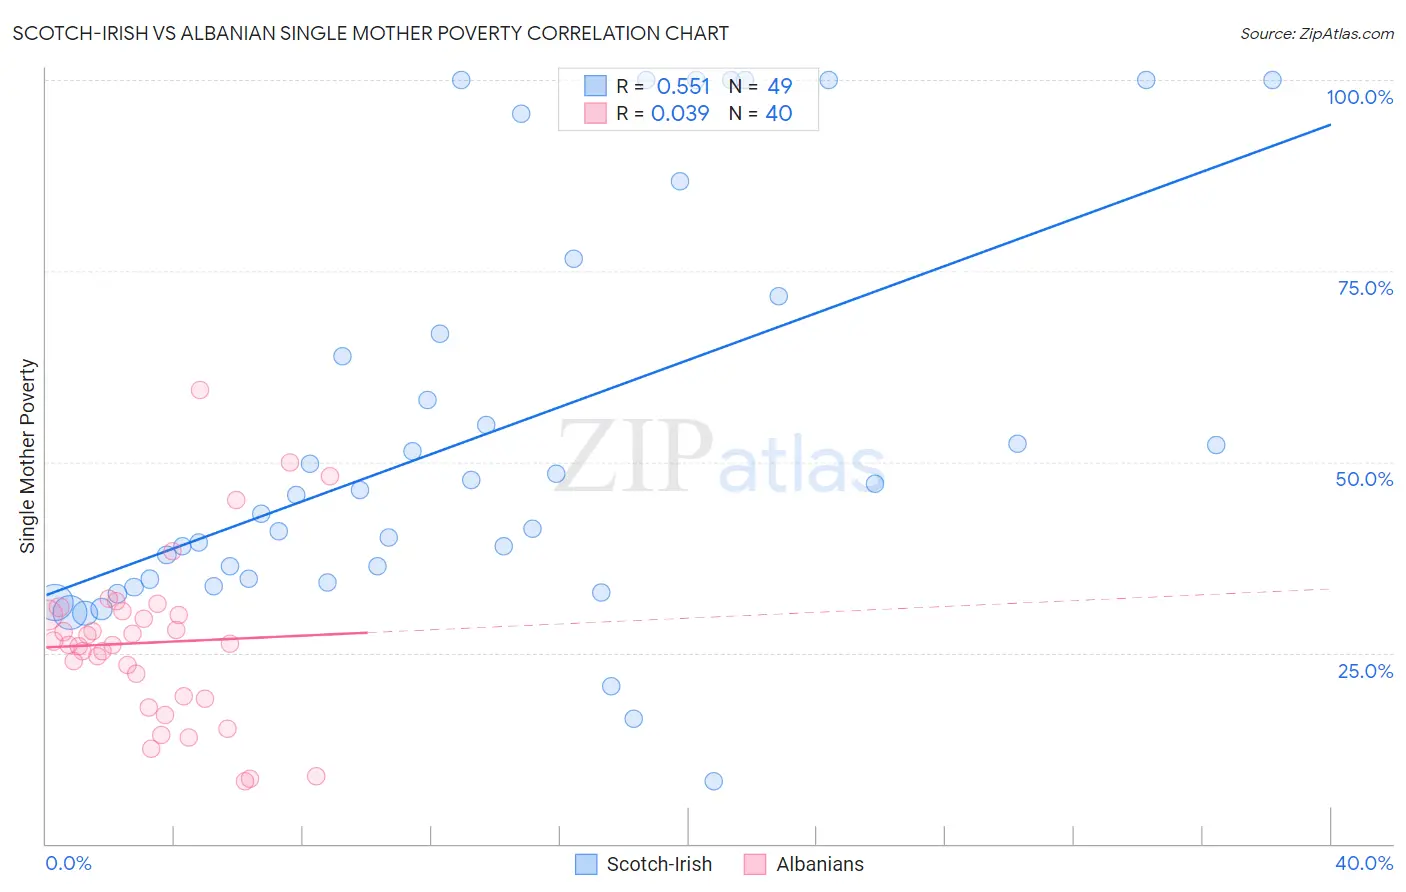
Scotch-Irish vs Albanian Single Mother Poverty Correlation Chart
The statistical analysis conducted on geographies consisting of 524,083,922 people shows a substantial positive correlation between the proportion of Scotch-Irish and poverty level among single mothers in the United States with a correlation coefficient (R) of 0.551 and weighted average of 31.5%. Similarly, the statistical analysis conducted on geographies consisting of 189,512,988 people shows no correlation between the proportion of Albanians and poverty level among single mothers in the United States with a correlation coefficient (R) of 0.039 and weighted average of 27.9%, a difference of 12.9%.
Single Mother Poverty Correlation Summary
| Measurement | Scotch-Irish | Albanian |
| Minimum | 8.1% | 8.1% |
| Maximum | 100.0% | 59.4% |
| Range | 91.9% | 51.3% |
| Mean | 53.3% | 26.4% |
| Median | 45.6% | 26.1% |
| Interquartile 25% (IQ1) | 34.5% | 19.1% |
| Interquartile 75% (IQ3) | 69.2% | 30.2% |
| Interquartile Range (IQR) | 34.7% | 11.1% |
| Standard Deviation (Sample) | 26.2% | 11.0% |
| Standard Deviation (Population) | 25.9% | 10.8% |
Similar Demographics by Single Mother Poverty
Demographics Similar to Scotch-Irish by Single Mother Poverty
In terms of single mother poverty, the demographic groups most similar to Scotch-Irish are Immigrants from Senegal (31.5%, a difference of 0.040%), British West Indian (31.5%, a difference of 0.050%), Immigrants from Belize (31.4%, a difference of 0.22%), Immigrants from Cabo Verde (31.6%, a difference of 0.29%), and Immigrants from Micronesia (31.6%, a difference of 0.30%).
| Demographics | Rating | Rank | Single Mother Poverty |
| Hmong | 0.3 /100 | #262 | Tragic 31.2% |
| Bahamians | 0.2 /100 | #263 | Tragic 31.3% |
| Immigrants | Ecuador | 0.2 /100 | #264 | Tragic 31.3% |
| German Russians | 0.2 /100 | #265 | Tragic 31.3% |
| Sub-Saharan Africans | 0.2 /100 | #266 | Tragic 31.4% |
| Immigrants | Belize | 0.2 /100 | #267 | Tragic 31.4% |
| Immigrants | Senegal | 0.1 /100 | #268 | Tragic 31.5% |
| Scotch-Irish | 0.1 /100 | #269 | Tragic 31.5% |
| British West Indians | 0.1 /100 | #270 | Tragic 31.5% |
| Immigrants | Cabo Verde | 0.1 /100 | #271 | Tragic 31.6% |
| Immigrants | Micronesia | 0.1 /100 | #272 | Tragic 31.6% |
| Fijians | 0.1 /100 | #273 | Tragic 31.6% |
| Bangladeshis | 0.1 /100 | #274 | Tragic 31.7% |
| Central Americans | 0.1 /100 | #275 | Tragic 31.8% |
| Delaware | 0.0 /100 | #276 | Tragic 31.8% |
Demographics Similar to Albanians by Single Mother Poverty
In terms of single mother poverty, the demographic groups most similar to Albanians are Chilean (27.9%, a difference of 0.030%), Romanian (27.8%, a difference of 0.10%), Immigrants from Iraq (27.9%, a difference of 0.13%), Immigrants from Brazil (27.9%, a difference of 0.17%), and Immigrants from Nepal (27.9%, a difference of 0.18%).
| Demographics | Rating | Rank | Single Mother Poverty |
| Afghans | 98.5 /100 | #87 | Exceptional 27.7% |
| Ethiopians | 98.4 /100 | #88 | Exceptional 27.7% |
| Immigrants | Ethiopia | 98.4 /100 | #89 | Exceptional 27.7% |
| Immigrants | France | 98.2 /100 | #90 | Exceptional 27.8% |
| Immigrants | Albania | 98.0 /100 | #91 | Exceptional 27.8% |
| Estonians | 97.9 /100 | #92 | Exceptional 27.8% |
| Romanians | 97.8 /100 | #93 | Exceptional 27.8% |
| Albanians | 97.6 /100 | #94 | Exceptional 27.9% |
| Chileans | 97.5 /100 | #95 | Exceptional 27.9% |
| Immigrants | Iraq | 97.3 /100 | #96 | Exceptional 27.9% |
| Immigrants | Brazil | 97.2 /100 | #97 | Exceptional 27.9% |
| Immigrants | Nepal | 97.2 /100 | #98 | Exceptional 27.9% |
| Immigrants | Netherlands | 97.2 /100 | #99 | Exceptional 27.9% |
| Zimbabweans | 97.1 /100 | #100 | Exceptional 27.9% |
| Pakistanis | 96.9 /100 | #101 | Exceptional 28.0% |