Scandinavian vs Assyrian/Chaldean/Syriac Child Poverty Among Girls Under 16
COMPARE
Scandinavian
Assyrian/Chaldean/Syriac
Child Poverty Among Girls Under 16
Child Poverty Among Girls Under 16 Comparison
Scandinavians
Assyrians/Chaldeans/Syriacs
14.4%
CHILD POVERTY AMONG GIRLS UNDER 16
98.7/ 100
METRIC RATING
62nd/ 347
METRIC RANK
13.3%
CHILD POVERTY AMONG GIRLS UNDER 16
99.9/ 100
METRIC RATING
21st/ 347
METRIC RANK
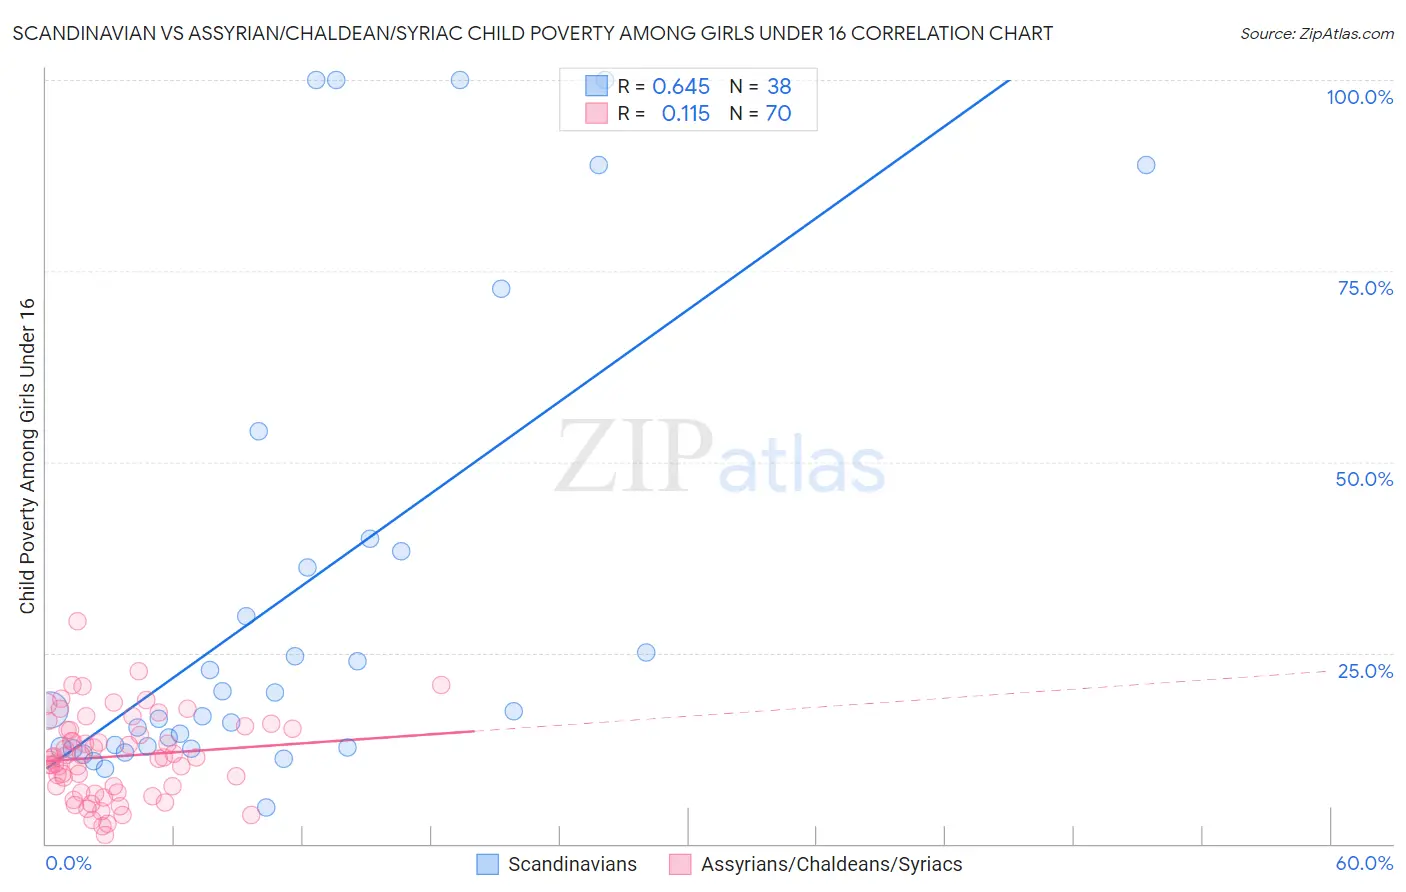
Scandinavian vs Assyrian/Chaldean/Syriac Child Poverty Among Girls Under 16 Correlation Chart
The statistical analysis conducted on geographies consisting of 459,652,874 people shows a significant positive correlation between the proportion of Scandinavians and poverty level among girls under the age of 16 in the United States with a correlation coefficient (R) of 0.645 and weighted average of 14.4%. Similarly, the statistical analysis conducted on geographies consisting of 109,412,963 people shows a poor positive correlation between the proportion of Assyrians/Chaldeans/Syriacs and poverty level among girls under the age of 16 in the United States with a correlation coefficient (R) of 0.115 and weighted average of 13.3%, a difference of 8.5%.
Child Poverty Among Girls Under 16 Correlation Summary
| Measurement | Scandinavian | Assyrian/Chaldean/Syriac |
| Minimum | 4.8% | 1.1% |
| Maximum | 100.0% | 29.1% |
| Range | 95.2% | 28.0% |
| Mean | 32.8% | 11.4% |
| Median | 17.5% | 11.3% |
| Interquartile 25% (IQ1) | 12.7% | 6.8% |
| Interquartile 75% (IQ3) | 38.4% | 15.0% |
| Interquartile Range (IQR) | 25.7% | 8.3% |
| Standard Deviation (Sample) | 30.8% | 5.6% |
| Standard Deviation (Population) | 30.4% | 5.5% |
Similar Demographics by Child Poverty Among Girls Under 16
Demographics Similar to Scandinavians by Child Poverty Among Girls Under 16
In terms of child poverty among girls under 16, the demographic groups most similar to Scandinavians are Immigrants from Europe (14.4%, a difference of 0.050%), Cambodian (14.4%, a difference of 0.11%), Polish (14.4%, a difference of 0.12%), Immigrants from Philippines (14.4%, a difference of 0.16%), and Immigrants from Sweden (14.5%, a difference of 0.19%).
| Demographics | Rating | Rank | Child Poverty Among Girls Under 16 |
| Immigrants | Romania | 98.9 /100 | #55 | Exceptional 14.3% |
| Immigrants | Indonesia | 98.9 /100 | #56 | Exceptional 14.4% |
| Immigrants | Serbia | 98.9 /100 | #57 | Exceptional 14.4% |
| Immigrants | Bulgaria | 98.8 /100 | #58 | Exceptional 14.4% |
| Zimbabweans | 98.8 /100 | #59 | Exceptional 14.4% |
| Poles | 98.7 /100 | #60 | Exceptional 14.4% |
| Cambodians | 98.7 /100 | #61 | Exceptional 14.4% |
| Scandinavians | 98.7 /100 | #62 | Exceptional 14.4% |
| Immigrants | Europe | 98.7 /100 | #63 | Exceptional 14.4% |
| Immigrants | Philippines | 98.6 /100 | #64 | Exceptional 14.4% |
| Immigrants | Sweden | 98.6 /100 | #65 | Exceptional 14.5% |
| Immigrants | Belgium | 98.5 /100 | #66 | Exceptional 14.5% |
| Laotians | 98.4 /100 | #67 | Exceptional 14.5% |
| Immigrants | Argentina | 98.3 /100 | #68 | Exceptional 14.6% |
| Immigrants | Poland | 98.2 /100 | #69 | Exceptional 14.6% |
Demographics Similar to Assyrians/Chaldeans/Syriacs by Child Poverty Among Girls Under 16
In terms of child poverty among girls under 16, the demographic groups most similar to Assyrians/Chaldeans/Syriacs are Immigrants from Japan (13.3%, a difference of 0.12%), Indian (Asian) (13.3%, a difference of 0.20%), Norwegian (13.3%, a difference of 0.37%), Immigrants from Eastern Asia (13.4%, a difference of 0.46%), and Cypriot (13.2%, a difference of 0.78%).
| Demographics | Rating | Rank | Child Poverty Among Girls Under 16 |
| Burmese | 99.9 /100 | #14 | Exceptional 13.0% |
| Okinawans | 99.9 /100 | #15 | Exceptional 13.0% |
| Immigrants | Lithuania | 99.9 /100 | #16 | Exceptional 13.1% |
| Bulgarians | 99.9 /100 | #17 | Exceptional 13.1% |
| Immigrants | Korea | 99.9 /100 | #18 | Exceptional 13.1% |
| Cypriots | 99.9 /100 | #19 | Exceptional 13.2% |
| Immigrants | Japan | 99.9 /100 | #20 | Exceptional 13.3% |
| Assyrians/Chaldeans/Syriacs | 99.9 /100 | #21 | Exceptional 13.3% |
| Indians (Asian) | 99.9 /100 | #22 | Exceptional 13.3% |
| Norwegians | 99.9 /100 | #23 | Exceptional 13.3% |
| Immigrants | Eastern Asia | 99.9 /100 | #24 | Exceptional 13.4% |
| Immigrants | China | 99.8 /100 | #25 | Exceptional 13.4% |
| Eastern Europeans | 99.8 /100 | #26 | Exceptional 13.5% |
| Latvians | 99.8 /100 | #27 | Exceptional 13.5% |
| Tongans | 99.8 /100 | #28 | Exceptional 13.6% |