Russian vs Immigrants from Colombia Female Poverty
COMPARE
Russian
Immigrants from Colombia
Female Poverty
Female Poverty Comparison
Russians
Immigrants from Colombia
11.8%
FEMALE POVERTY
99.3/ 100
METRIC RATING
38th/ 347
METRIC RANK
13.5%
FEMALE POVERTY
44.5/ 100
METRIC RATING
182nd/ 347
METRIC RANK
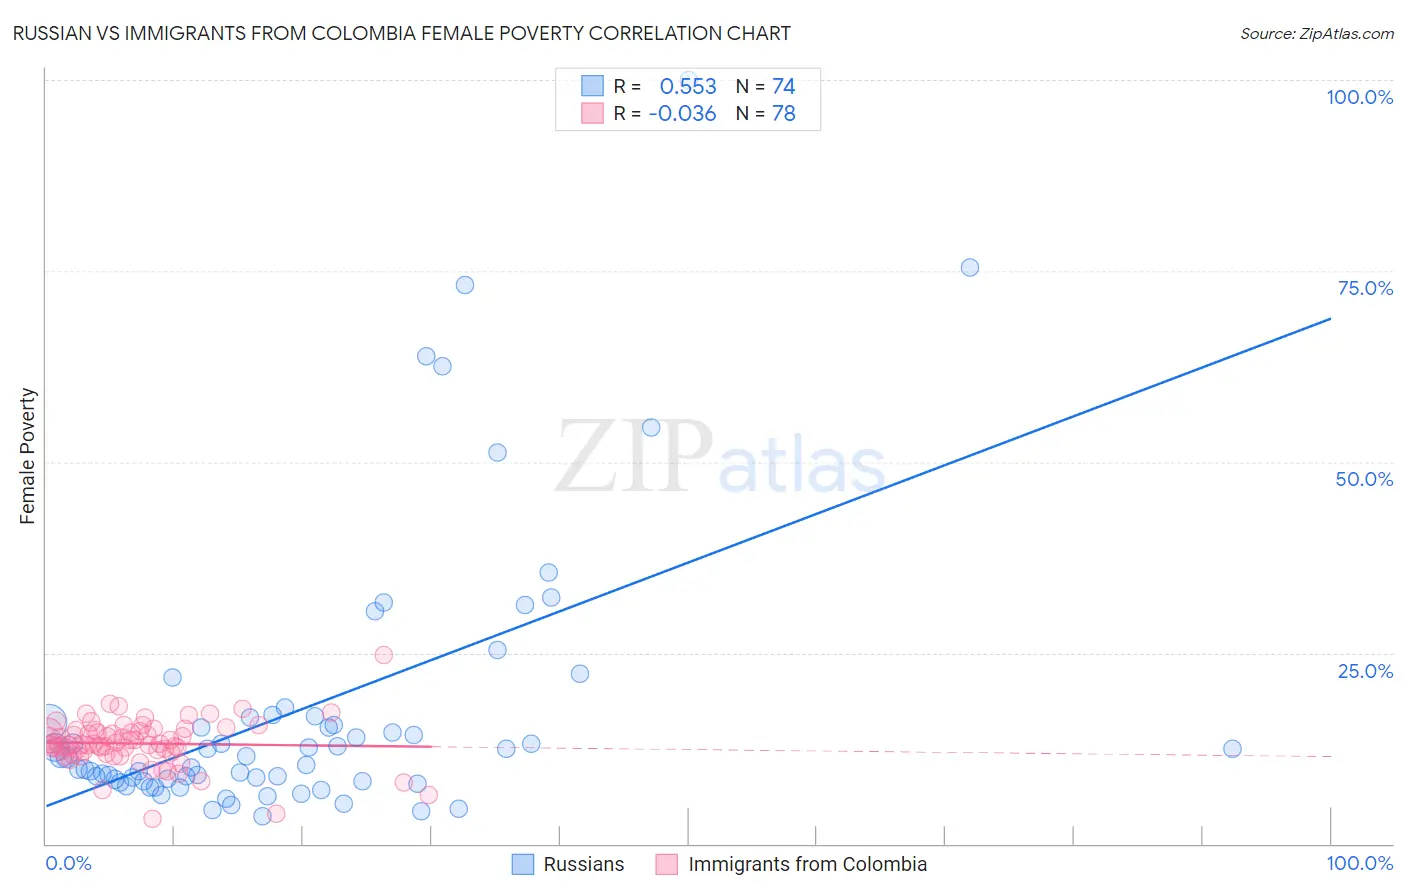
Russian vs Immigrants from Colombia Female Poverty Correlation Chart
The statistical analysis conducted on geographies consisting of 511,408,549 people shows a substantial positive correlation between the proportion of Russians and poverty level among females in the United States with a correlation coefficient (R) of 0.553 and weighted average of 11.8%. Similarly, the statistical analysis conducted on geographies consisting of 378,418,098 people shows no correlation between the proportion of Immigrants from Colombia and poverty level among females in the United States with a correlation coefficient (R) of -0.036 and weighted average of 13.5%, a difference of 14.3%.
Female Poverty Correlation Summary
| Measurement | Russian | Immigrants from Colombia |
| Minimum | 3.6% | 3.2% |
| Maximum | 100.0% | 24.7% |
| Range | 96.4% | 21.5% |
| Mean | 17.7% | 13.1% |
| Median | 11.4% | 13.1% |
| Interquartile 25% (IQ1) | 8.2% | 11.9% |
| Interquartile 75% (IQ3) | 16.5% | 14.7% |
| Interquartile Range (IQR) | 8.2% | 2.8% |
| Standard Deviation (Sample) | 18.5% | 3.1% |
| Standard Deviation (Population) | 18.4% | 3.1% |
Similar Demographics by Female Poverty
Demographics Similar to Russians by Female Poverty
In terms of female poverty, the demographic groups most similar to Russians are Immigrants from Greece (11.8%, a difference of 0.020%), Immigrants from Pakistan (11.8%, a difference of 0.11%), Immigrants from Poland (11.8%, a difference of 0.21%), Macedonian (11.8%, a difference of 0.26%), and Immigrants from Iran (11.8%, a difference of 0.28%).
| Demographics | Rating | Rank | Female Poverty |
| Poles | 99.5 /100 | #31 | Exceptional 11.7% |
| Danes | 99.5 /100 | #32 | Exceptional 11.7% |
| Cypriots | 99.5 /100 | #33 | Exceptional 11.8% |
| Immigrants | Singapore | 99.4 /100 | #34 | Exceptional 11.8% |
| Immigrants | Iran | 99.4 /100 | #35 | Exceptional 11.8% |
| Immigrants | Pakistan | 99.4 /100 | #36 | Exceptional 11.8% |
| Immigrants | Greece | 99.3 /100 | #37 | Exceptional 11.8% |
| Russians | 99.3 /100 | #38 | Exceptional 11.8% |
| Immigrants | Poland | 99.3 /100 | #39 | Exceptional 11.8% |
| Macedonians | 99.3 /100 | #40 | Exceptional 11.8% |
| Czechs | 99.2 /100 | #41 | Exceptional 11.9% |
| Immigrants | Moldova | 99.2 /100 | #42 | Exceptional 11.9% |
| Koreans | 99.2 /100 | #43 | Exceptional 11.9% |
| Tongans | 99.2 /100 | #44 | Exceptional 11.9% |
| Immigrants | Czechoslovakia | 99.2 /100 | #45 | Exceptional 11.9% |
Demographics Similar to Immigrants from Colombia by Female Poverty
In terms of female poverty, the demographic groups most similar to Immigrants from Colombia are Venezuelan (13.5%, a difference of 0.0%), South American (13.5%, a difference of 0.030%), Kenyan (13.5%, a difference of 0.070%), Immigrants from Sierra Leone (13.5%, a difference of 0.13%), and Immigrants from Cameroon (13.5%, a difference of 0.24%).
| Demographics | Rating | Rank | Female Poverty |
| Celtics | 49.9 /100 | #175 | Average 13.4% |
| Immigrants | Spain | 49.9 /100 | #176 | Average 13.4% |
| Immigrants | Morocco | 49.4 /100 | #177 | Average 13.4% |
| Israelis | 49.1 /100 | #178 | Average 13.5% |
| Immigrants | Syria | 48.8 /100 | #179 | Average 13.5% |
| South Americans | 44.8 /100 | #180 | Average 13.5% |
| Venezuelans | 44.5 /100 | #181 | Average 13.5% |
| Immigrants | Colombia | 44.5 /100 | #182 | Average 13.5% |
| Kenyans | 43.8 /100 | #183 | Average 13.5% |
| Immigrants | Sierra Leone | 43.2 /100 | #184 | Average 13.5% |
| Immigrants | Cameroon | 42.0 /100 | #185 | Average 13.5% |
| Immigrants | Portugal | 41.5 /100 | #186 | Average 13.6% |
| Immigrants | Venezuela | 41.0 /100 | #187 | Average 13.6% |
| Hawaiians | 39.9 /100 | #188 | Fair 13.6% |
| Uruguayans | 39.8 /100 | #189 | Fair 13.6% |