Romanian vs Immigrants from Czechoslovakia Receiving Food Stamps
COMPARE
Romanian
Immigrants from Czechoslovakia
Receiving Food Stamps
Receiving Food Stamps Comparison
Romanians
Immigrants from Czechoslovakia
10.4%
RECEIVING FOOD STAMPS
95.8/ 100
METRIC RATING
111th/ 347
METRIC RANK
9.6%
RECEIVING FOOD STAMPS
99.4/ 100
METRIC RATING
49th/ 347
METRIC RANK
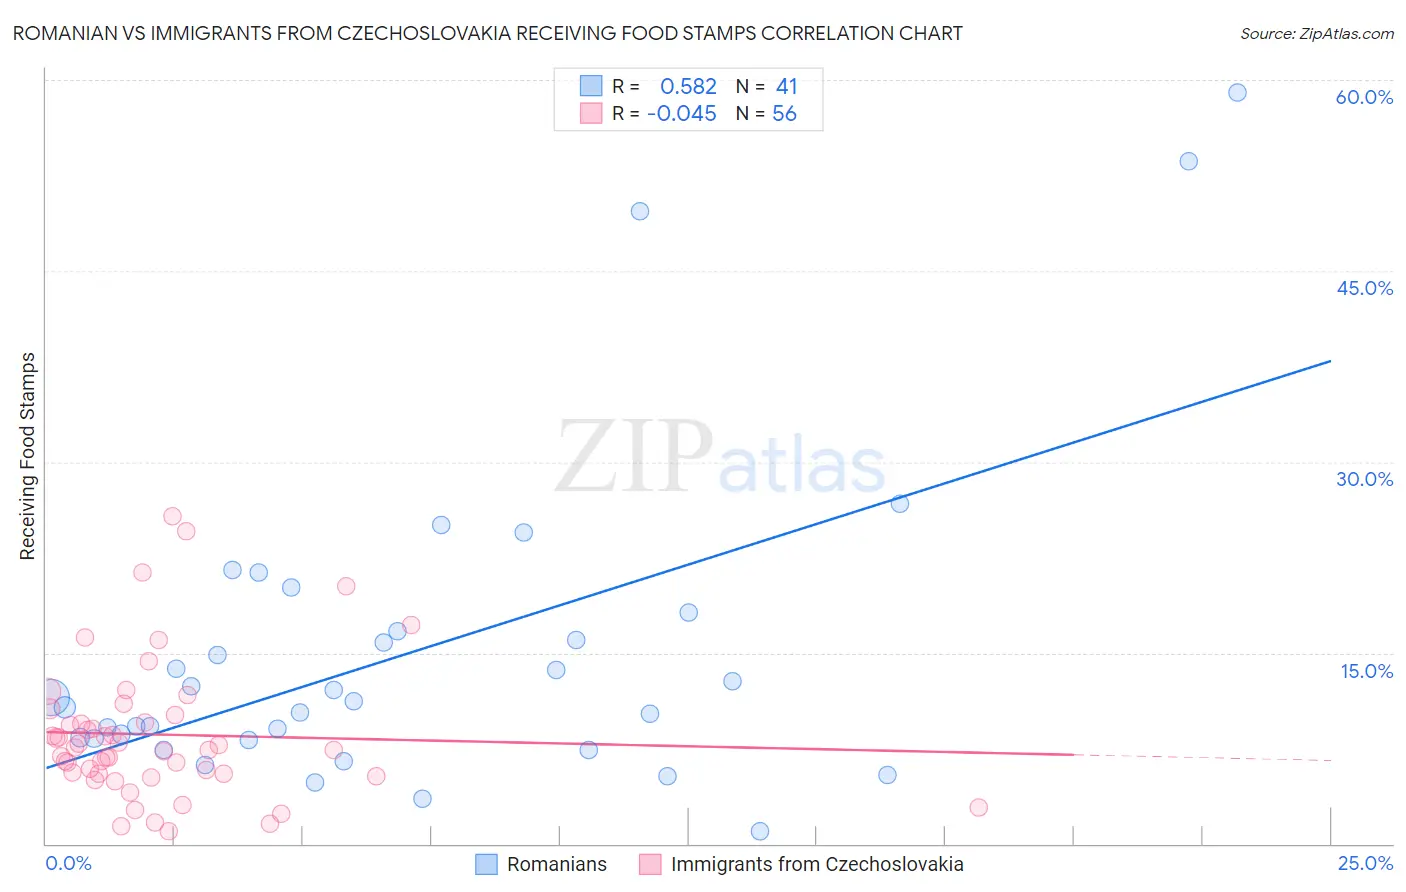
Romanian vs Immigrants from Czechoslovakia Receiving Food Stamps Correlation Chart
The statistical analysis conducted on geographies consisting of 376,766,958 people shows a substantial positive correlation between the proportion of Romanians and percentage of population receiving government assistance and/or food stamps in the United States with a correlation coefficient (R) of 0.582 and weighted average of 10.4%. Similarly, the statistical analysis conducted on geographies consisting of 195,237,921 people shows no correlation between the proportion of Immigrants from Czechoslovakia and percentage of population receiving government assistance and/or food stamps in the United States with a correlation coefficient (R) of -0.045 and weighted average of 9.6%, a difference of 8.4%.
Receiving Food Stamps Correlation Summary
| Measurement | Romanian | Immigrants from Czechoslovakia |
| Minimum | 1.0% | 1.0% |
| Maximum | 59.0% | 25.7% |
| Range | 58.0% | 24.7% |
| Mean | 15.1% | 8.6% |
| Median | 11.1% | 7.5% |
| Interquartile 25% (IQ1) | 8.2% | 5.5% |
| Interquartile 75% (IQ3) | 17.4% | 9.8% |
| Interquartile Range (IQR) | 9.2% | 4.3% |
| Standard Deviation (Sample) | 12.6% | 5.4% |
| Standard Deviation (Population) | 12.5% | 5.3% |
Similar Demographics by Receiving Food Stamps
Demographics Similar to Romanians by Receiving Food Stamps
In terms of receiving food stamps, the demographic groups most similar to Romanians are Mongolian (10.5%, a difference of 0.010%), Pakistani (10.4%, a difference of 0.10%), Immigrants from Pakistan (10.4%, a difference of 0.38%), Icelander (10.5%, a difference of 0.39%), and Carpatho Rusyn (10.4%, a difference of 0.43%).
| Demographics | Rating | Rank | Receiving Food Stamps |
| Immigrants | Hungary | 96.7 /100 | #104 | Exceptional 10.3% |
| Immigrants | Malaysia | 96.5 /100 | #105 | Exceptional 10.4% |
| Immigrants | Italy | 96.4 /100 | #106 | Exceptional 10.4% |
| Koreans | 96.3 /100 | #107 | Exceptional 10.4% |
| Carpatho Rusyns | 96.2 /100 | #108 | Exceptional 10.4% |
| Immigrants | Pakistan | 96.2 /100 | #109 | Exceptional 10.4% |
| Pakistanis | 95.9 /100 | #110 | Exceptional 10.4% |
| Romanians | 95.8 /100 | #111 | Exceptional 10.4% |
| Mongolians | 95.8 /100 | #112 | Exceptional 10.5% |
| Icelanders | 95.4 /100 | #113 | Exceptional 10.5% |
| Scotch-Irish | 95.1 /100 | #114 | Exceptional 10.5% |
| Immigrants | Saudi Arabia | 94.9 /100 | #115 | Exceptional 10.5% |
| Canadians | 94.8 /100 | #116 | Exceptional 10.5% |
| Immigrants | Nepal | 94.6 /100 | #117 | Exceptional 10.6% |
| Assyrians/Chaldeans/Syriacs | 94.1 /100 | #118 | Exceptional 10.6% |
Demographics Similar to Immigrants from Czechoslovakia by Receiving Food Stamps
In terms of receiving food stamps, the demographic groups most similar to Immigrants from Czechoslovakia are Russian (9.6%, a difference of 0.020%), Indian (Asian) (9.6%, a difference of 0.13%), Australian (9.6%, a difference of 0.19%), Lithuanian (9.7%, a difference of 0.25%), and Immigrants from Belgium (9.6%, a difference of 0.27%).
| Demographics | Rating | Rank | Receiving Food Stamps |
| Immigrants | China | 99.5 /100 | #42 | Exceptional 9.6% |
| Croatians | 99.5 /100 | #43 | Exceptional 9.6% |
| Immigrants | Denmark | 99.4 /100 | #44 | Exceptional 9.6% |
| Immigrants | Belgium | 99.4 /100 | #45 | Exceptional 9.6% |
| Australians | 99.4 /100 | #46 | Exceptional 9.6% |
| Indians (Asian) | 99.4 /100 | #47 | Exceptional 9.6% |
| Russians | 99.4 /100 | #48 | Exceptional 9.6% |
| Immigrants | Czechoslovakia | 99.4 /100 | #49 | Exceptional 9.6% |
| Lithuanians | 99.4 /100 | #50 | Exceptional 9.7% |
| Asians | 99.3 /100 | #51 | Exceptional 9.7% |
| Immigrants | South Africa | 99.3 /100 | #52 | Exceptional 9.7% |
| Tongans | 99.3 /100 | #53 | Exceptional 9.7% |
| Swiss | 99.3 /100 | #54 | Exceptional 9.7% |
| Immigrants | Switzerland | 99.3 /100 | #55 | Exceptional 9.7% |
| Immigrants | Canada | 99.3 /100 | #56 | Exceptional 9.7% |