Puget Sound Salish vs Palestinian Female Poverty Among 18-24 Year Olds
COMPARE
Puget Sound Salish
Palestinian
Female Poverty Among 18-24 Year Olds
Female Poverty Among 18-24 Year Olds Comparison
Puget Sound Salish
Palestinians
18.0%
FEMALE POVERTY AMONG 18-24 YEAR OLDS
100.0/ 100
METRIC RATING
39th/ 347
METRIC RANK
18.8%
FEMALE POVERTY AMONG 18-24 YEAR OLDS
99.5/ 100
METRIC RATING
80th/ 347
METRIC RANK
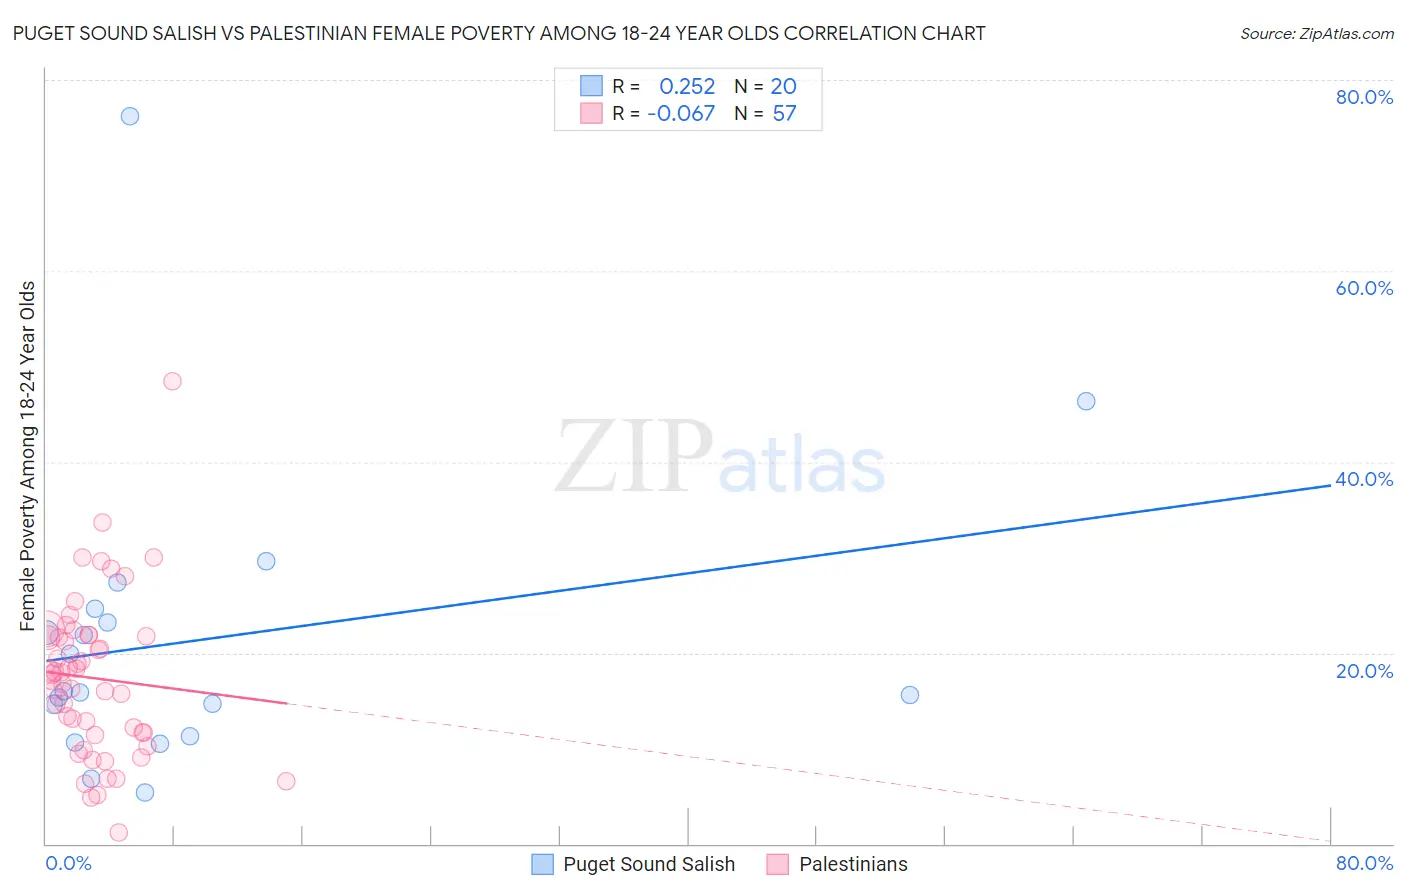
Puget Sound Salish vs Palestinian Female Poverty Among 18-24 Year Olds Correlation Chart
The statistical analysis conducted on geographies consisting of 45,843,522 people shows a weak positive correlation between the proportion of Puget Sound Salish and poverty level among females between the ages 18 and 24 in the United States with a correlation coefficient (R) of 0.252 and weighted average of 18.0%. Similarly, the statistical analysis conducted on geographies consisting of 214,096,345 people shows a slight negative correlation between the proportion of Palestinians and poverty level among females between the ages 18 and 24 in the United States with a correlation coefficient (R) of -0.067 and weighted average of 18.8%, a difference of 4.6%.
Female Poverty Among 18-24 Year Olds Correlation Summary
| Measurement | Puget Sound Salish | Palestinian |
| Minimum | 5.3% | 1.2% |
| Maximum | 76.2% | 48.5% |
| Range | 70.9% | 47.3% |
| Mean | 21.4% | 17.4% |
| Median | 15.9% | 17.8% |
| Interquartile 25% (IQ1) | 12.9% | 11.5% |
| Interquartile 75% (IQ3) | 23.9% | 21.8% |
| Interquartile Range (IQR) | 11.0% | 10.3% |
| Standard Deviation (Sample) | 15.9% | 8.3% |
| Standard Deviation (Population) | 15.4% | 8.3% |
Similar Demographics by Female Poverty Among 18-24 Year Olds
Demographics Similar to Puget Sound Salish by Female Poverty Among 18-24 Year Olds
In terms of female poverty among 18-24 year olds, the demographic groups most similar to Puget Sound Salish are Immigrants from Romania (18.0%, a difference of 0.030%), Immigrants from Argentina (18.0%, a difference of 0.040%), South American (18.0%, a difference of 0.21%), Immigrants from Croatia (17.9%, a difference of 0.43%), and Immigrants from South America (17.9%, a difference of 0.49%).
| Demographics | Rating | Rank | Female Poverty Among 18-24 Year Olds |
| Immigrants | Moldova | 100.0 /100 | #32 | Exceptional 17.9% |
| Native Hawaiians | 100.0 /100 | #33 | Exceptional 17.9% |
| Immigrants | Nicaragua | 100.0 /100 | #34 | Exceptional 17.9% |
| Immigrants | Greece | 100.0 /100 | #35 | Exceptional 17.9% |
| Immigrants | South America | 100.0 /100 | #36 | Exceptional 17.9% |
| Immigrants | Croatia | 100.0 /100 | #37 | Exceptional 17.9% |
| South Americans | 100.0 /100 | #38 | Exceptional 18.0% |
| Puget Sound Salish | 100.0 /100 | #39 | Exceptional 18.0% |
| Immigrants | Romania | 100.0 /100 | #40 | Exceptional 18.0% |
| Immigrants | Argentina | 100.0 /100 | #41 | Exceptional 18.0% |
| Bulgarians | 100.0 /100 | #42 | Exceptional 18.1% |
| Macedonians | 100.0 /100 | #43 | Exceptional 18.1% |
| Nicaraguans | 100.0 /100 | #44 | Exceptional 18.1% |
| Spanish American Indians | 100.0 /100 | #45 | Exceptional 18.1% |
| Immigrants | Southern Europe | 100.0 /100 | #46 | Exceptional 18.2% |
Demographics Similar to Palestinians by Female Poverty Among 18-24 Year Olds
In terms of female poverty among 18-24 year olds, the demographic groups most similar to Palestinians are Japanese (18.8%, a difference of 0.0%), Immigrants from Europe (18.8%, a difference of 0.080%), Uruguayan (18.8%, a difference of 0.080%), Costa Rican (18.8%, a difference of 0.090%), and Immigrants from Uruguay (18.8%, a difference of 0.11%).
| Demographics | Rating | Rank | Female Poverty Among 18-24 Year Olds |
| Lithuanians | 99.7 /100 | #73 | Exceptional 18.7% |
| Hawaiians | 99.6 /100 | #74 | Exceptional 18.7% |
| Poles | 99.6 /100 | #75 | Exceptional 18.8% |
| Immigrants | Cambodia | 99.5 /100 | #76 | Exceptional 18.8% |
| Costa Ricans | 99.5 /100 | #77 | Exceptional 18.8% |
| Immigrants | Europe | 99.5 /100 | #78 | Exceptional 18.8% |
| Uruguayans | 99.5 /100 | #79 | Exceptional 18.8% |
| Palestinians | 99.5 /100 | #80 | Exceptional 18.8% |
| Japanese | 99.5 /100 | #81 | Exceptional 18.8% |
| Immigrants | Uruguay | 99.4 /100 | #82 | Exceptional 18.8% |
| Immigrants | Indonesia | 99.4 /100 | #83 | Exceptional 18.9% |
| Burmese | 99.2 /100 | #84 | Exceptional 18.9% |
| Immigrants | Armenia | 99.2 /100 | #85 | Exceptional 18.9% |
| Immigrants | Iraq | 99.2 /100 | #86 | Exceptional 18.9% |
| Immigrants | Jamaica | 99.2 /100 | #87 | Exceptional 18.9% |