Puerto Rican vs Immigrants from Scotland Single Female Poverty
COMPARE
Puerto Rican
Immigrants from Scotland
Single Female Poverty
Single Female Poverty Comparison
Puerto Ricans
Immigrants from Scotland
34.1%
SINGLE FEMALE POVERTY
0.0/ 100
METRIC RATING
346th/ 347
METRIC RANK
19.4%
SINGLE FEMALE POVERTY
99.2/ 100
METRIC RATING
81st/ 347
METRIC RANK
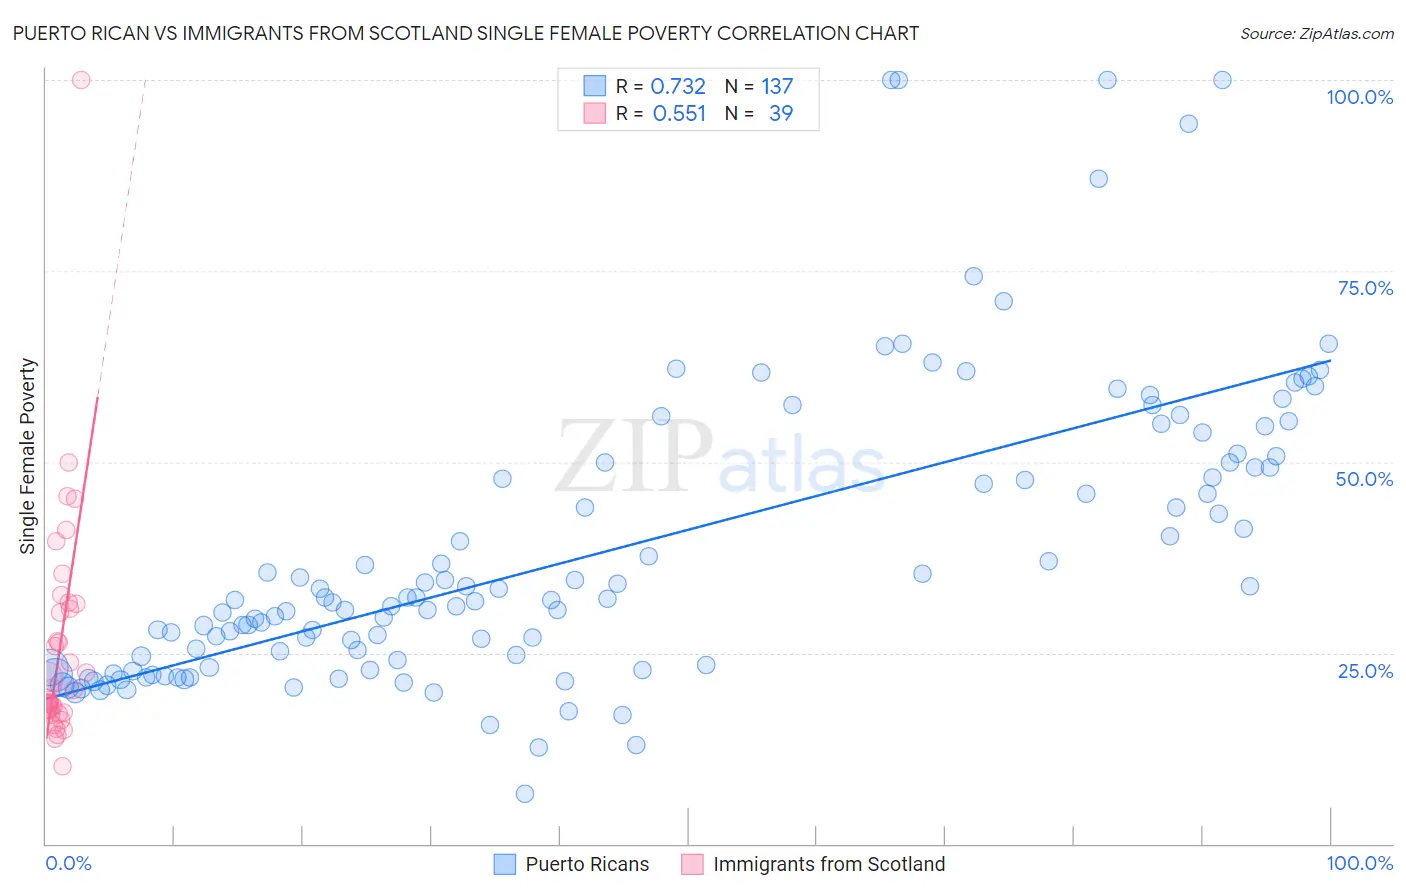
Puerto Rican vs Immigrants from Scotland Single Female Poverty Correlation Chart
The statistical analysis conducted on geographies consisting of 515,297,886 people shows a strong positive correlation between the proportion of Puerto Ricans and poverty level among single females in the United States with a correlation coefficient (R) of 0.732 and weighted average of 34.1%. Similarly, the statistical analysis conducted on geographies consisting of 194,087,969 people shows a substantial positive correlation between the proportion of Immigrants from Scotland and poverty level among single females in the United States with a correlation coefficient (R) of 0.551 and weighted average of 19.4%, a difference of 75.7%.
Single Female Poverty Correlation Summary
| Measurement | Puerto Rican | Immigrants from Scotland |
| Minimum | 6.5% | 10.1% |
| Maximum | 100.0% | 100.0% |
| Range | 93.5% | 89.9% |
| Mean | 38.4% | 26.0% |
| Median | 31.9% | 20.2% |
| Interquartile 25% (IQ1) | 23.2% | 17.1% |
| Interquartile 75% (IQ3) | 49.9% | 31.4% |
| Interquartile Range (IQR) | 26.7% | 14.3% |
| Standard Deviation (Sample) | 19.4% | 15.7% |
| Standard Deviation (Population) | 19.3% | 15.5% |
Similar Demographics by Single Female Poverty
Demographics Similar to Puerto Ricans by Single Female Poverty
In terms of single female poverty, the demographic groups most similar to Puerto Ricans are Tohono O'odham (34.2%, a difference of 0.30%), Houma (33.8%, a difference of 0.92%), Lumbee (33.0%, a difference of 3.3%), Crow (32.4%, a difference of 5.2%), and Navajo (31.7%, a difference of 7.7%).
| Demographics | Rating | Rank | Single Female Poverty |
| Ute | 0.0 /100 | #333 | Tragic 28.4% |
| Pueblo | 0.0 /100 | #334 | Tragic 28.6% |
| Immigrants | Yemen | 0.0 /100 | #335 | Tragic 28.9% |
| Colville | 0.0 /100 | #336 | Tragic 29.1% |
| Yuman | 0.0 /100 | #337 | Tragic 29.4% |
| Pima | 0.0 /100 | #338 | Tragic 30.3% |
| Cheyenne | 0.0 /100 | #339 | Tragic 30.4% |
| Cajuns | 0.0 /100 | #340 | Tragic 30.6% |
| Sioux | 0.0 /100 | #341 | Tragic 31.3% |
| Navajo | 0.0 /100 | #342 | Tragic 31.7% |
| Crow | 0.0 /100 | #343 | Tragic 32.4% |
| Lumbee | 0.0 /100 | #344 | Tragic 33.0% |
| Houma | 0.0 /100 | #345 | Tragic 33.8% |
| Puerto Ricans | 0.0 /100 | #346 | Tragic 34.1% |
| Tohono O'odham | 0.0 /100 | #347 | Tragic 34.2% |
Demographics Similar to Immigrants from Scotland by Single Female Poverty
In terms of single female poverty, the demographic groups most similar to Immigrants from Scotland are Immigrants from Malaysia (19.4%, a difference of 0.010%), Immigrants from Australia (19.4%, a difference of 0.020%), Taiwanese (19.4%, a difference of 0.020%), Immigrants from Sierra Leone (19.4%, a difference of 0.060%), and Albanian (19.4%, a difference of 0.080%).
| Demographics | Rating | Rank | Single Female Poverty |
| Immigrants | Belarus | 99.4 /100 | #74 | Exceptional 19.3% |
| Immigrants | Turkey | 99.4 /100 | #75 | Exceptional 19.4% |
| Peruvians | 99.4 /100 | #76 | Exceptional 19.4% |
| Immigrants | Russia | 99.3 /100 | #77 | Exceptional 19.4% |
| Albanians | 99.3 /100 | #78 | Exceptional 19.4% |
| Immigrants | Sierra Leone | 99.3 /100 | #79 | Exceptional 19.4% |
| Immigrants | Australia | 99.3 /100 | #80 | Exceptional 19.4% |
| Immigrants | Scotland | 99.2 /100 | #81 | Exceptional 19.4% |
| Immigrants | Malaysia | 99.2 /100 | #82 | Exceptional 19.4% |
| Taiwanese | 99.2 /100 | #83 | Exceptional 19.4% |
| Immigrants | Sweden | 99.2 /100 | #84 | Exceptional 19.4% |
| Immigrants | Albania | 99.2 /100 | #85 | Exceptional 19.4% |
| Greeks | 99.2 /100 | #86 | Exceptional 19.4% |
| Zimbabweans | 99.0 /100 | #87 | Exceptional 19.5% |
| Afghans | 99.0 /100 | #88 | Exceptional 19.5% |