Potawatomi vs Malaysian Child Poverty Among Girls Under 16
COMPARE
Potawatomi
Malaysian
Child Poverty Among Girls Under 16
Child Poverty Among Girls Under 16 Comparison
Potawatomi
Malaysians
19.2%
CHILD POVERTY AMONG GIRLS UNDER 16
0.3/ 100
METRIC RATING
249th/ 347
METRIC RANK
17.8%
CHILD POVERTY AMONG GIRLS UNDER 16
5.7/ 100
METRIC RATING
214th/ 347
METRIC RANK
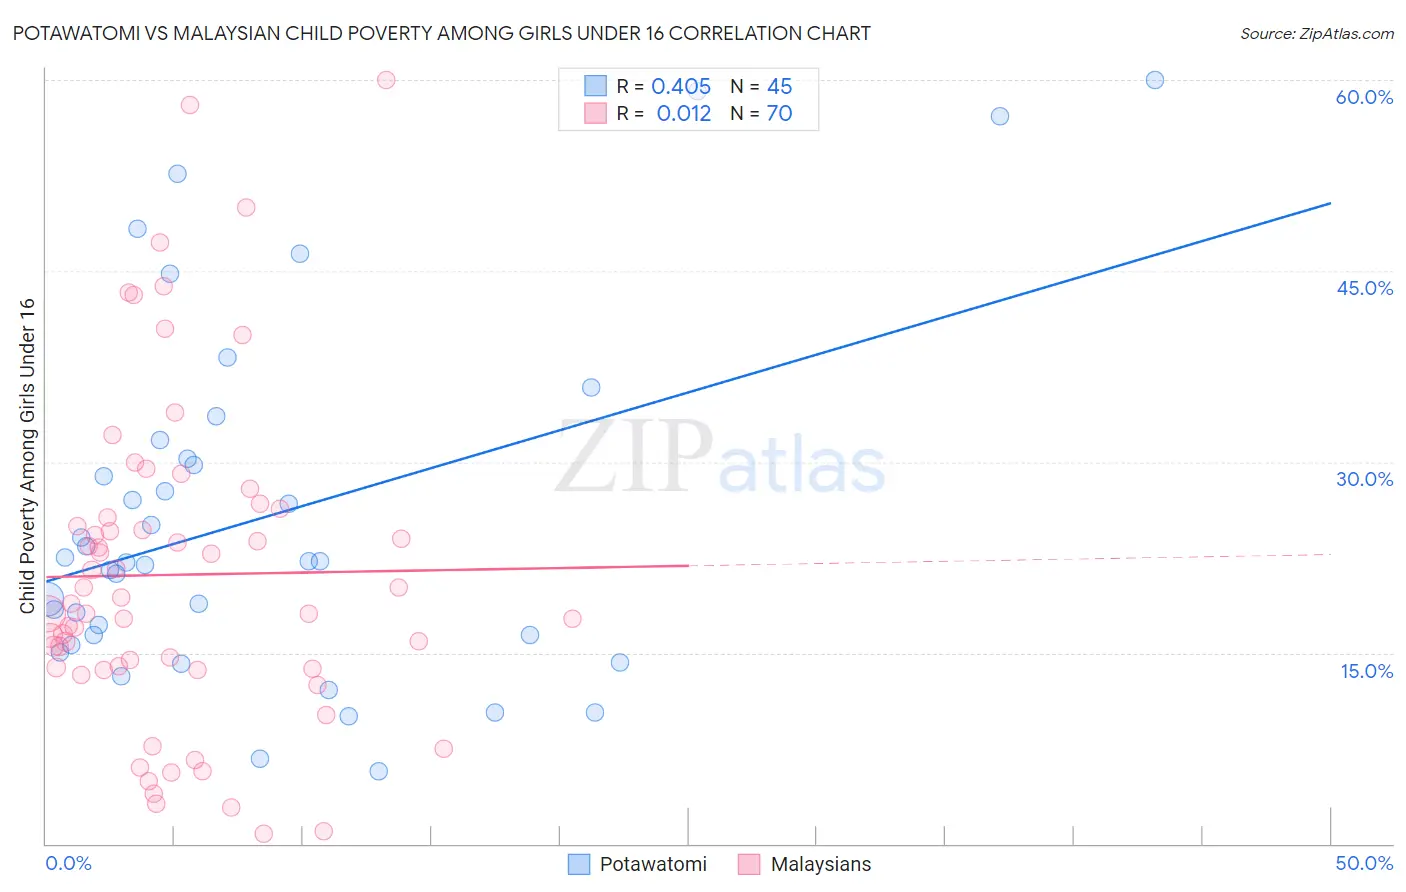
Potawatomi vs Malaysian Child Poverty Among Girls Under 16 Correlation Chart
The statistical analysis conducted on geographies consisting of 117,080,271 people shows a moderate positive correlation between the proportion of Potawatomi and poverty level among girls under the age of 16 in the United States with a correlation coefficient (R) of 0.405 and weighted average of 19.2%. Similarly, the statistical analysis conducted on geographies consisting of 224,243,890 people shows no correlation between the proportion of Malaysians and poverty level among girls under the age of 16 in the United States with a correlation coefficient (R) of 0.012 and weighted average of 17.8%, a difference of 7.9%.
Child Poverty Among Girls Under 16 Correlation Summary
| Measurement | Potawatomi | Malaysian |
| Minimum | 5.7% | 0.81% |
| Maximum | 60.0% | 60.0% |
| Range | 54.3% | 59.2% |
| Mean | 25.7% | 21.1% |
| Median | 22.2% | 18.5% |
| Interquartile 25% (IQ1) | 16.0% | 13.8% |
| Interquartile 75% (IQ3) | 31.0% | 25.6% |
| Interquartile Range (IQR) | 15.0% | 11.8% |
| Standard Deviation (Sample) | 14.0% | 12.9% |
| Standard Deviation (Population) | 13.8% | 12.8% |
Similar Demographics by Child Poverty Among Girls Under 16
Demographics Similar to Potawatomi by Child Poverty Among Girls Under 16
In terms of child poverty among girls under 16, the demographic groups most similar to Potawatomi are French American Indian (19.2%, a difference of 0.020%), Cape Verdean (19.2%, a difference of 0.030%), Immigrants from Trinidad and Tobago (19.2%, a difference of 0.14%), Immigrants from Middle Africa (19.2%, a difference of 0.18%), and Immigrants from Guyana (19.3%, a difference of 0.38%).
| Demographics | Rating | Rank | Child Poverty Among Girls Under 16 |
| Immigrants | Cuba | 0.7 /100 | #242 | Tragic 18.8% |
| Immigrants | Nicaragua | 0.7 /100 | #243 | Tragic 18.8% |
| Ecuadorians | 0.7 /100 | #244 | Tragic 18.8% |
| Shoshone | 0.6 /100 | #245 | Tragic 18.9% |
| Immigrants | Laos | 0.6 /100 | #246 | Tragic 18.9% |
| Immigrants | Ghana | 0.5 /100 | #247 | Tragic 18.9% |
| French American Indians | 0.3 /100 | #248 | Tragic 19.2% |
| Potawatomi | 0.3 /100 | #249 | Tragic 19.2% |
| Cape Verdeans | 0.3 /100 | #250 | Tragic 19.2% |
| Immigrants | Trinidad and Tobago | 0.3 /100 | #251 | Tragic 19.2% |
| Immigrants | Middle Africa | 0.3 /100 | #252 | Tragic 19.2% |
| Immigrants | Guyana | 0.3 /100 | #253 | Tragic 19.3% |
| Immigrants | Western Africa | 0.3 /100 | #254 | Tragic 19.3% |
| Immigrants | Ecuador | 0.3 /100 | #255 | Tragic 19.3% |
| Trinidadians and Tobagonians | 0.2 /100 | #256 | Tragic 19.3% |
Demographics Similar to Malaysians by Child Poverty Among Girls Under 16
In terms of child poverty among girls under 16, the demographic groups most similar to Malaysians are German Russian (17.8%, a difference of 0.0%), Pennsylvania German (17.8%, a difference of 0.020%), Moroccan (17.8%, a difference of 0.10%), Japanese (17.8%, a difference of 0.19%), and Immigrants from Thailand (17.7%, a difference of 0.28%).
| Demographics | Rating | Rank | Child Poverty Among Girls Under 16 |
| Hmong | 10.6 /100 | #207 | Poor 17.5% |
| Sierra Leoneans | 8.9 /100 | #208 | Tragic 17.6% |
| Panamanians | 8.7 /100 | #209 | Tragic 17.6% |
| Immigrants | Immigrants | 7.3 /100 | #210 | Tragic 17.7% |
| Immigrants | Eastern Africa | 6.4 /100 | #211 | Tragic 17.7% |
| Immigrants | Thailand | 6.3 /100 | #212 | Tragic 17.7% |
| Pennsylvania Germans | 5.7 /100 | #213 | Tragic 17.8% |
| Malaysians | 5.7 /100 | #214 | Tragic 17.8% |
| German Russians | 5.7 /100 | #215 | Tragic 17.8% |
| Moroccans | 5.5 /100 | #216 | Tragic 17.8% |
| Japanese | 5.3 /100 | #217 | Tragic 17.8% |
| Alaska Natives | 5.2 /100 | #218 | Tragic 17.8% |
| Immigrants | Panama | 4.7 /100 | #219 | Tragic 17.9% |
| Cubans | 4.1 /100 | #220 | Tragic 18.0% |
| Immigrants | Micronesia | 3.5 /100 | #221 | Tragic 18.0% |