Potawatomi vs Liberian Single Mother Poverty
COMPARE
Potawatomi
Liberian
Single Mother Poverty
Single Mother Poverty Comparison
Potawatomi
Liberians
34.1%
SINGLE MOTHER POVERTY
0.0/ 100
METRIC RATING
309th/ 347
METRIC RANK
29.9%
SINGLE MOTHER POVERTY
11.7/ 100
METRIC RATING
214th/ 347
METRIC RANK
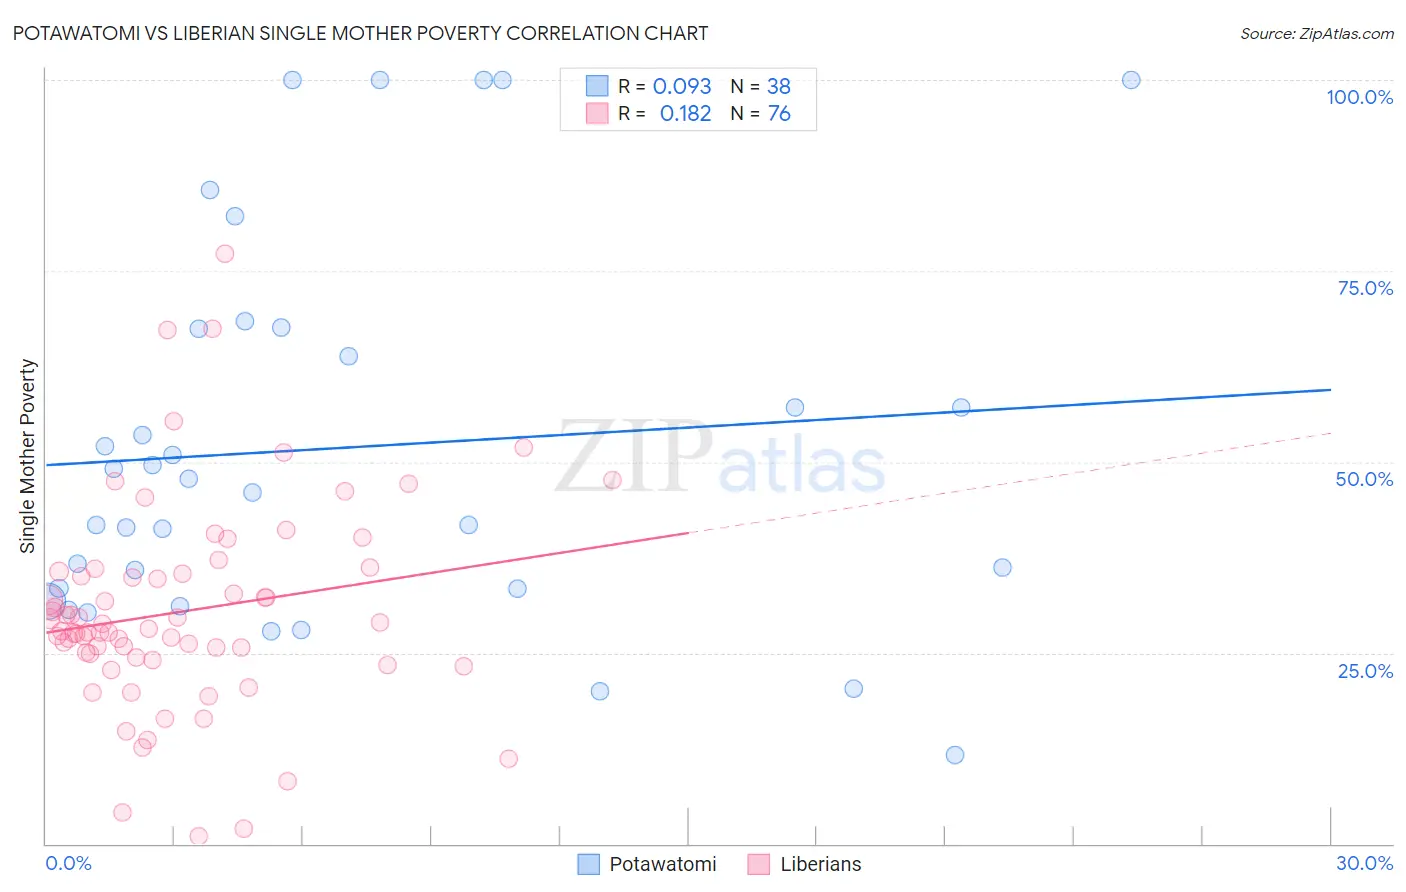
Potawatomi vs Liberian Single Mother Poverty Correlation Chart
The statistical analysis conducted on geographies consisting of 116,799,639 people shows a slight positive correlation between the proportion of Potawatomi and poverty level among single mothers in the United States with a correlation coefficient (R) of 0.093 and weighted average of 34.1%. Similarly, the statistical analysis conducted on geographies consisting of 117,524,642 people shows a poor positive correlation between the proportion of Liberians and poverty level among single mothers in the United States with a correlation coefficient (R) of 0.182 and weighted average of 29.9%, a difference of 14.2%.
Single Mother Poverty Correlation Summary
| Measurement | Potawatomi | Liberian |
| Minimum | 11.6% | 1.1% |
| Maximum | 100.0% | 77.3% |
| Range | 88.4% | 76.3% |
| Mean | 51.9% | 30.4% |
| Median | 46.9% | 28.0% |
| Interquartile 25% (IQ1) | 33.3% | 24.7% |
| Interquartile 75% (IQ3) | 67.5% | 35.5% |
| Interquartile Range (IQR) | 34.2% | 10.8% |
| Standard Deviation (Sample) | 25.0% | 13.6% |
| Standard Deviation (Population) | 24.6% | 13.5% |
Similar Demographics by Single Mother Poverty
Demographics Similar to Potawatomi by Single Mother Poverty
In terms of single mother poverty, the demographic groups most similar to Potawatomi are Honduran (34.2%, a difference of 0.22%), Immigrants from Mexico (34.0%, a difference of 0.42%), Alsatian (34.3%, a difference of 0.53%), Comanche (33.9%, a difference of 0.60%), and Central American Indian (34.3%, a difference of 0.61%).
| Demographics | Rating | Rank | Single Mother Poverty |
| Arapaho | 0.0 /100 | #302 | Tragic 33.4% |
| Americans | 0.0 /100 | #303 | Tragic 33.5% |
| Mexicans | 0.0 /100 | #304 | Tragic 33.6% |
| Immigrants | Central America | 0.0 /100 | #305 | Tragic 33.6% |
| Immigrants | Congo | 0.0 /100 | #306 | Tragic 33.8% |
| Comanche | 0.0 /100 | #307 | Tragic 33.9% |
| Immigrants | Mexico | 0.0 /100 | #308 | Tragic 34.0% |
| Potawatomi | 0.0 /100 | #309 | Tragic 34.1% |
| Hondurans | 0.0 /100 | #310 | Tragic 34.2% |
| Alsatians | 0.0 /100 | #311 | Tragic 34.3% |
| Central American Indians | 0.0 /100 | #312 | Tragic 34.3% |
| Immigrants | Dominican Republic | 0.0 /100 | #313 | Tragic 34.4% |
| Chickasaw | 0.0 /100 | #314 | Tragic 34.4% |
| Hopi | 0.0 /100 | #315 | Tragic 34.5% |
| Dominicans | 0.0 /100 | #316 | Tragic 34.5% |
Demographics Similar to Liberians by Single Mother Poverty
In terms of single mother poverty, the demographic groups most similar to Liberians are Jamaican (29.9%, a difference of 0.0%), Immigrants from Western Africa (29.9%, a difference of 0.020%), Immigrants from Thailand (29.9%, a difference of 0.030%), Immigrants from Ghana (29.9%, a difference of 0.050%), and Nicaraguan (29.8%, a difference of 0.080%).
| Demographics | Rating | Rank | Single Mother Poverty |
| Immigrants | Panama | 15.5 /100 | #207 | Poor 29.8% |
| Immigrants | Guyana | 14.7 /100 | #208 | Poor 29.8% |
| Irish | 13.9 /100 | #209 | Poor 29.8% |
| Haitians | 13.3 /100 | #210 | Poor 29.8% |
| Guyanese | 12.8 /100 | #211 | Poor 29.8% |
| Nicaraguans | 12.4 /100 | #212 | Poor 29.8% |
| Immigrants | Thailand | 12.0 /100 | #213 | Poor 29.9% |
| Liberians | 11.7 /100 | #214 | Poor 29.9% |
| Jamaicans | 11.7 /100 | #215 | Poor 29.9% |
| Immigrants | Western Africa | 11.5 /100 | #216 | Poor 29.9% |
| Immigrants | Ghana | 11.3 /100 | #217 | Poor 29.9% |
| Hungarians | 10.3 /100 | #218 | Poor 29.9% |
| Finns | 9.3 /100 | #219 | Tragic 30.0% |
| Germans | 8.8 /100 | #220 | Tragic 30.0% |
| Immigrants | Eritrea | 7.7 /100 | #221 | Tragic 30.0% |