Potawatomi vs Immigrants from Ethiopia Single Male Poverty

COMPARE

Potawatomi
Race
Ancestry
AfghanAfricanAlaska NativeAlaskan AthabascanAlbanianAleutAlsatianAmericanApacheArabArapahoArgentineanArmenianAssyrian/Chaldean/SyriacAustralianAustrianBahamianBangladeshiBarbadianBasqueBelgianBelizeanBermudanBhutaneseBlackfeetBolivianBrazilianBritishBritish West IndianBulgarianBurmeseCajunCambodianCanadianCape VerdeanCarpatho RusynCelticCentral AmericanCentral American IndianCherokeeCheyenneChickasawChileanChineseChippewaChoctawColombianColvilleComancheCosta RicanCreeCreekCroatianCrowCubanCypriotCzechCzechoslovakianDanishDelawareDominicanDutchDutch West IndianEastern EuropeanEcuadorianEgyptianEnglishEstonianEthiopianEuropeanFijianFilipinoFinnishFrenchFrench American IndianFrench CanadianGermanGerman RussianGhanaianGreekGuamanian/ChamorroGuatemalanGuyaneseHaitianHmongHonduranHopiHoumaHungarianIcelanderIndian (Asian)IndonesianInupiatIranianIraqiIrishIroquoisIsraeliItalianJamaicanJapaneseJordanianKenyanKiowaKoreanLaotianLatvianLebaneseLiberianLithuanianLumbeeLuxembourgerMacedonianMalaysianMalteseMarshalleseMenomineeMexicanMexican American IndianMongolianMoroccanNative HawaiianNavajoNepaleseNew ZealanderNicaraguanNigerianNorthern EuropeanNorwegianOkinawanOsageOttawaPaiutePakistaniPalestinianPanamanianParaguayanPennsylvania GermanPeruvianPimaPolishPortuguesePotawatomiPuebloPuerto RicanPuget Sound SalishRomanianRussianSalvadoranSamoanScandinavianScotch-IrishScottishSeminoleSenegaleseSerbianShoshoneSierra LeoneanSiouxSlavicSlovakSloveneSomaliSouth AfricanSouth AmericanSouth American IndianSoviet UnionSpaniardSpanishSpanish AmericanSpanish American IndianSri LankanSubsaharan AfricanSudaneseSwedishSwissSyrianTaiwaneseThaiTlingit-HaidaTohono O'OdhamTonganTrinidadian and TobagonianTsimshianTurkishU.S. Virgin IslanderUgandanUkrainianUruguayanUteVenezuelanVietnameseWelshWest IndianYakamaYaquiYugoslavianYumanYup'ikZimbabwean
Immigration
NonimmigrantsImmigrantsAfghanistanAfricaAlbaniaArgentinaArmeniaAsiaAustraliaAustriaBahamasBangladeshBarbadosBelarusBelgiumBelizeBoliviaBosnia and HerzegovinaBrazilBulgariaBurma/MyanmarCabo VerdeCambodiaCameroonCanadaCaribbeanCentral AmericaChileChinaColombiaCongoCosta RicaCroatiaCubaCzechoslovakiaDenmarkDominicaDominican RepublicEastern AfricaEastern AsiaEastern EuropeEcuadorEgyptEl SalvadorEnglandEritreaEuropeFijiFranceGermanyGhanaGreeceGrenadaGuatemalaGuyanaHaitiHondurasHong KongHungaryIndiaIndonesiaIranIraqIrelandIsraelItalyJamaicaJapanJordanKazakhstanKenyaKoreaKuwaitLaosLatin AmericaLatviaLebanonLiberiaLithuaniaMalaysiaMexicoMicronesiaMiddle AfricaMoldovaMoroccoNepalNetherlandsNicaraguaNigeriaNorth AmericaNorth MacedoniaNorthern AfricaNorthern EuropeNorwayOceaniaPakistanPanamaPeruPhilippinesPolandPortugalRomaniaRussiaSaudi ArabiaScotlandSenegalSerbiaSierra LeoneSingaporeSomaliaSouth AfricaSouth AmericaSouth Central AsiaSouth Eastern AsiaSouthern EuropeSpainSri LankaSt. Vincent and the GrenadinesSudanSwedenSwitzerlandSyriaTaiwanThailandTrinidad and TobagoTurkeyUgandaUkraineUruguayUzbekistanVenezuelaVietnamWest IndiesWestern AfricaWestern AsiaWestern EuropeYemenZaireZimbabweAzores
Immigrants from Ethiopia
Race
Ancestry
AfghanAfricanAlaska NativeAlaskan AthabascanAlbanianAleutAlsatianAmericanApacheArabArapahoArgentineanArmenianAssyrian/Chaldean/SyriacAustralianAustrianBahamianBangladeshiBarbadianBasqueBelgianBelizeanBermudanBhutaneseBlackfeetBolivianBrazilianBritishBritish West IndianBulgarianBurmeseCajunCambodianCanadianCape VerdeanCarpatho RusynCelticCentral AmericanCentral American IndianCherokeeCheyenneChickasawChileanChineseChippewaChoctawColombianColvilleComancheCosta RicanCreeCreekCroatianCrowCubanCypriotCzechCzechoslovakianDanishDelawareDominicanDutchDutch West IndianEastern EuropeanEcuadorianEgyptianEnglishEstonianEthiopianEuropeanFijianFilipinoFinnishFrenchFrench American IndianFrench CanadianGermanGerman RussianGhanaianGreekGuamanian/ChamorroGuatemalanGuyaneseHaitianHmongHonduranHopiHoumaHungarianIcelanderIndian (Asian)IndonesianInupiatIranianIraqiIrishIroquoisIsraeliItalianJamaicanJapaneseJordanianKenyanKiowaKoreanLaotianLatvianLebaneseLiberianLithuanianLumbeeLuxembourgerMacedonianMalaysianMalteseMarshalleseMenomineeMexicanMexican American IndianMongolianMoroccanNative HawaiianNavajoNepaleseNew ZealanderNicaraguanNigerianNorthern EuropeanNorwegianOkinawanOsageOttawaPaiutePakistaniPalestinianPanamanianParaguayanPennsylvania GermanPeruvianPimaPolishPortuguesePuebloPuerto RicanPuget Sound SalishRomanianRussianSalvadoranSamoanScandinavianScotch-IrishScottishSeminoleSenegaleseSerbianShoshoneSierra LeoneanSiouxSlavicSlovakSloveneSomaliSouth AfricanSouth AmericanSouth American IndianSoviet UnionSpaniardSpanishSpanish AmericanSpanish American IndianSri LankanSubsaharan AfricanSudaneseSwedishSwissSyrianTaiwaneseThaiTlingit-HaidaTohono O'OdhamTonganTrinidadian and TobagonianTsimshianTurkishU.S. Virgin IslanderUgandanUkrainianUruguayanUteVenezuelanVietnameseWelshWest IndianYakamaYaquiYugoslavianYumanYup'ikZimbabwean
Immigration
NonimmigrantsImmigrantsAfghanistanAfricaAlbaniaArgentinaArmeniaAsiaAustraliaAustriaBahamasBangladeshBarbadosBelarusBelgiumBelizeBoliviaBosnia and HerzegovinaBrazilBulgariaBurma/MyanmarCabo VerdeCambodiaCameroonCanadaCaribbeanCentral AmericaChileChinaColombiaCongoCosta RicaCroatiaCubaCzechoslovakiaDenmarkDominicaDominican RepublicEastern AfricaEastern AsiaEastern EuropeEcuadorEgyptEl SalvadorEnglandEritreaEthiopiaEuropeFijiFranceGermanyGhanaGreeceGrenadaGuatemalaGuyanaHaitiHondurasHong KongHungaryIndiaIndonesiaIranIraqIrelandIsraelItalyJamaicaJapanJordanKazakhstanKenyaKoreaKuwaitLaosLatin AmericaLatviaLebanonLiberiaLithuaniaMalaysiaMexicoMicronesiaMiddle AfricaMoldovaMoroccoNepalNetherlandsNicaraguaNigeriaNorth AmericaNorth MacedoniaNorthern AfricaNorthern EuropeNorwayOceaniaPakistanPanamaPeruPhilippinesPolandPortugalRomaniaRussiaSaudi ArabiaScotlandSenegalSerbiaSierra LeoneSingaporeSomaliaSouth AfricaSouth AmericaSouth Central AsiaSouth Eastern AsiaSouthern EuropeSpainSri LankaSt. Vincent and the GrenadinesSudanSwedenSwitzerlandSyriaTaiwanThailandTrinidad and TobagoTurkeyUgandaUkraineUruguayUzbekistanVenezuelaVietnamWest IndiesWestern AfricaWestern AsiaWestern EuropeYemenZaireZimbabweAzores
Single Male Poverty
Income
Poverty
Unemployment
Labor Participation
Family Structure
Vehicle Availability
Education Level
Disability

Single Male Poverty Comparison

Potawatomi

Immigrants from Ethiopia

Tragic
Exceptional
15.8%
SINGLE MALE POVERTY
0.0/ 100
METRIC RATING
308th/ 347
METRIC RANK
11.4%
SINGLE MALE POVERTY
100.0/ 100
METRIC RATING
34th/ 347
METRIC RANK

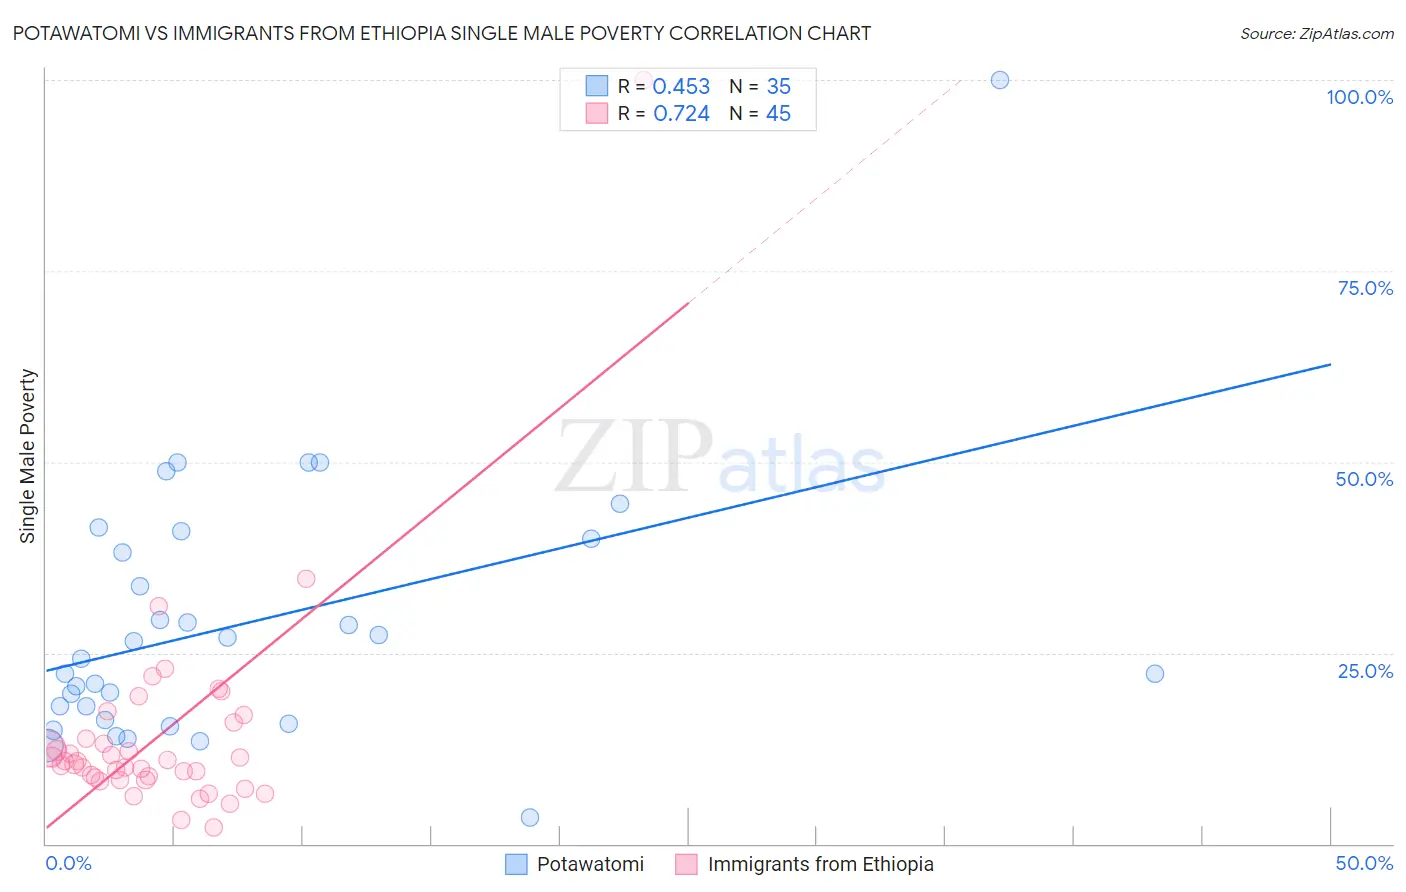
Potawatomi vs Immigrants from Ethiopia Single Male Poverty Correlation Chart

The statistical analysis conducted on geographies consisting of 112,014,628 people shows a moderate positive correlation between the proportion of Potawatomi and poverty level among single males in the United States with a correlation coefficient (R) of 0.453 and weighted average of 15.8%. Similarly, the statistical analysis conducted on geographies consisting of 197,139,840 people shows a strong positive correlation between the proportion of Immigrants from Ethiopia and poverty level among single males in the United States with a correlation coefficient (R) of 0.724 and weighted average of 11.4%, a difference of 37.9%.
Potawatomi vs Immigrants from Ethiopia Single Male Poverty

Single Male Poverty Correlation Summary

MeasurementPotawatomiImmigrants from Ethiopia
Minimum3.4%2.2%
Maximum100.0%100.0%
Range96.6%97.8%
Mean28.9%14.1%
Median24.3%10.8%
Interquartile 25% (IQ1)16.3%8.5%
Interquartile 75% (IQ3)40.0%14.8%
Interquartile Range (IQR)23.7%6.3%
Standard Deviation (Sample)17.6%14.6%
Standard Deviation (Population)17.3%14.4%

Similar Demographics by Single Male Poverty

Demographics Similar to Potawatomi by Single Male Poverty

In terms of single male poverty, the demographic groups most similar to Potawatomi are American (15.8%, a difference of 0.17%), Ute (15.7%, a difference of 0.57%), Yakama (15.9%, a difference of 1.0%), Pennsylvania German (15.6%, a difference of 1.3%), and Seminole (16.0%, a difference of 1.6%).
DemographicsRating | RankSingle Male Poverty
Dominicans
0.0
/100
|
#301
Tragic
15.2%
Alsatians
0.0
/100
|
#302
Tragic
15.2%
Aleuts
0.0
/100
|
#303
Tragic
15.4%
Alaska Natives
0.0
/100
|
#304
Tragic
15.4%
Blackfeet
0.0
/100
|
#305
Tragic
15.5%
Pennsylvania Germans
0.0
/100
|
#306
Tragic
15.6%
Ute
0.0
/100
|
#307
Tragic
15.7%
Potawatomi
0.0
/100
|
#308
Tragic
15.8%
Americans
0.0
/100
|
#309
Tragic
15.8%
Yakama
0.0
/100
|
#310
Tragic
15.9%
Seminole
0.0
/100
|
#311
Tragic
16.0%
Comanche
0.0
/100
|
#312
Tragic
16.0%
Cherokee
0.0
/100
|
#313
Tragic
16.1%
Alaskan Athabascans
0.0
/100
|
#314
Tragic
16.1%
Cheyenne
0.0
/100
|
#315
Tragic
16.1%

Demographics Similar to Immigrants from Ethiopia by Single Male Poverty

In terms of single male poverty, the demographic groups most similar to Immigrants from Ethiopia are Immigrants from Vietnam (11.4%, a difference of 0.040%), Immigrants from South Eastern Asia (11.4%, a difference of 0.040%), Immigrants from Serbia (11.4%, a difference of 0.070%), Immigrants from Eastern Asia (11.4%, a difference of 0.11%), and Immigrants from Singapore (11.4%, a difference of 0.12%).
DemographicsRating | RankSingle Male Poverty
Immigrants | China
100.0
/100
|
#27
Exceptional
11.4%
Immigrants | Asia
100.0
/100
|
#28
Exceptional
11.4%
Immigrants | Egypt
100.0
/100
|
#29
Exceptional
11.4%
Iranians
100.0
/100
|
#30
Exceptional
11.4%
Immigrants | Iran
100.0
/100
|
#31
Exceptional
11.4%
Immigrants | Eastern Asia
100.0
/100
|
#32
Exceptional
11.4%
Immigrants | Vietnam
100.0
/100
|
#33
Exceptional
11.4%
Immigrants | Ethiopia
100.0
/100
|
#34
Exceptional
11.4%
Immigrants | South Eastern Asia
100.0
/100
|
#35
Exceptional
11.4%
Immigrants | Serbia
100.0
/100
|
#36
Exceptional
11.4%
Immigrants | Singapore
100.0
/100
|
#37
Exceptional
11.4%
Sri Lankans
100.0
/100
|
#38
Exceptional
11.5%
Soviet Union
100.0
/100
|
#39
Exceptional
11.5%
Immigrants | Korea
100.0
/100
|
#40
Exceptional
11.5%
Immigrants | Iraq
99.9
/100
|
#41
Exceptional
11.5%