Potawatomi vs Immigrants from Caribbean Female Poverty Among 25-34 Year Olds
COMPARE
Potawatomi
Immigrants from Caribbean
Female Poverty Among 25-34 Year Olds
Female Poverty Among 25-34 Year Olds Comparison
Potawatomi
Immigrants from Caribbean
16.5%
FEMALE POVERTY AMONG 25-34 YEAR OLDS
0.0/ 100
METRIC RATING
293rd/ 347
METRIC RANK
15.7%
FEMALE POVERTY AMONG 25-34 YEAR OLDS
0.0/ 100
METRIC RATING
274th/ 347
METRIC RANK
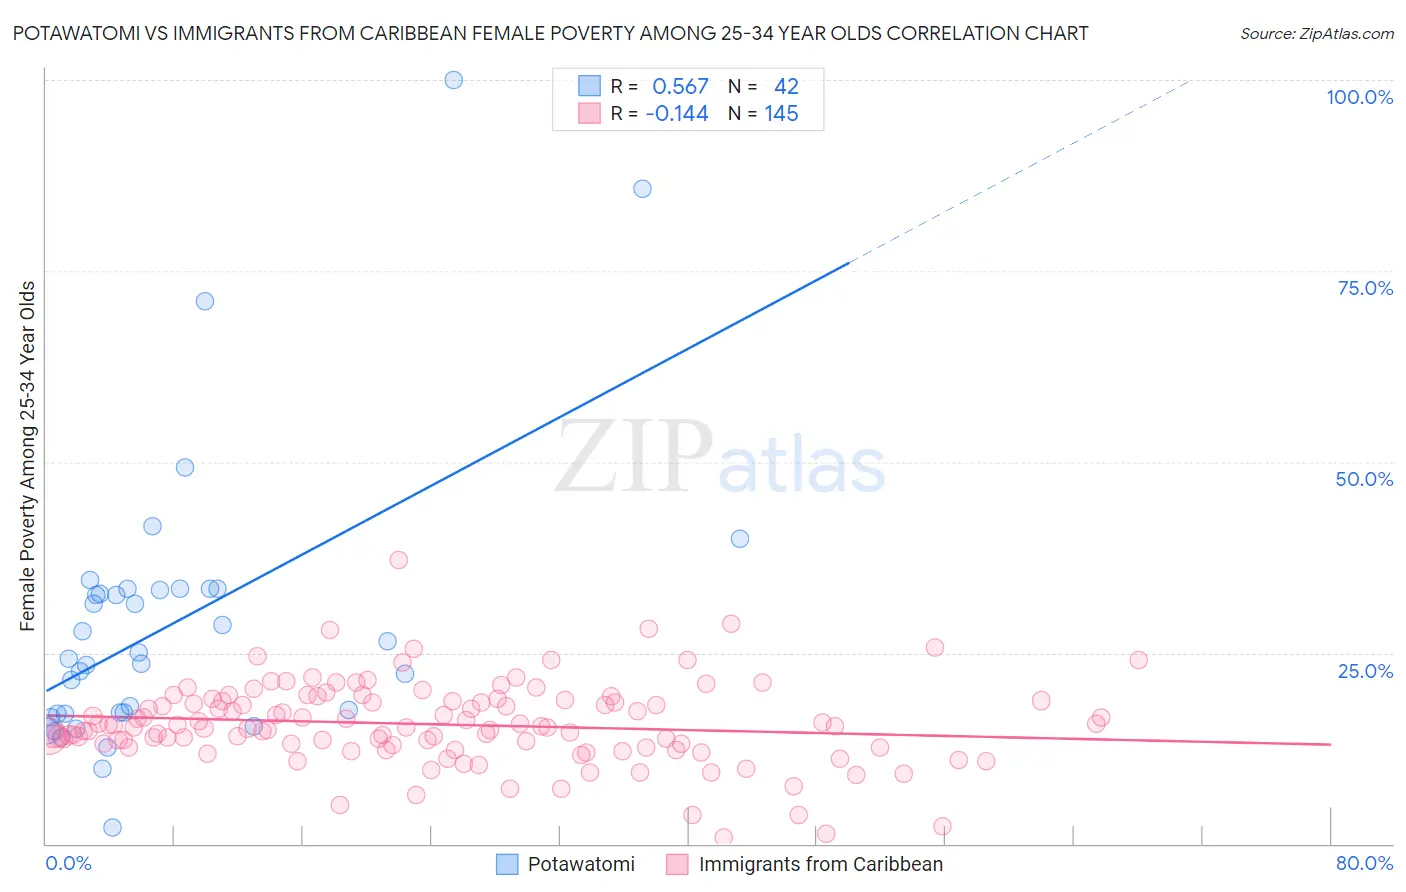
Potawatomi vs Immigrants from Caribbean Female Poverty Among 25-34 Year Olds Correlation Chart
The statistical analysis conducted on geographies consisting of 117,213,572 people shows a substantial positive correlation between the proportion of Potawatomi and poverty level among females between the ages 25 and 34 in the United States with a correlation coefficient (R) of 0.567 and weighted average of 16.5%. Similarly, the statistical analysis conducted on geographies consisting of 441,382,759 people shows a poor negative correlation between the proportion of Immigrants from Caribbean and poverty level among females between the ages 25 and 34 in the United States with a correlation coefficient (R) of -0.144 and weighted average of 15.7%, a difference of 5.1%.
Female Poverty Among 25-34 Year Olds Correlation Summary
| Measurement | Potawatomi | Immigrants from Caribbean |
| Minimum | 2.2% | 0.81% |
| Maximum | 100.0% | 37.1% |
| Range | 97.8% | 36.3% |
| Mean | 28.9% | 15.6% |
| Median | 24.6% | 15.2% |
| Interquartile 25% (IQ1) | 17.0% | 12.8% |
| Interquartile 75% (IQ3) | 33.3% | 18.7% |
| Interquartile Range (IQR) | 16.3% | 5.9% |
| Standard Deviation (Sample) | 18.8% | 5.4% |
| Standard Deviation (Population) | 18.6% | 5.3% |
Demographics Similar to Potawatomi and Immigrants from Caribbean by Female Poverty Among 25-34 Year Olds
In terms of female poverty among 25-34 year olds, the demographic groups most similar to Potawatomi are Immigrants from Dominica (16.5%, a difference of 0.27%), Comanche (16.5%, a difference of 0.28%), Indonesian (16.4%, a difference of 0.57%), Osage (16.4%, a difference of 0.73%), and Guatemalan (16.4%, a difference of 0.79%). Similarly, the demographic groups most similar to Immigrants from Caribbean are Immigrants from the Azores (15.8%, a difference of 0.35%), Nonimmigrants (15.6%, a difference of 0.49%), Immigrants from Zaire (15.8%, a difference of 0.78%), Immigrants from Micronesia (15.8%, a difference of 0.79%), and French American Indian (15.9%, a difference of 1.1%).
| Demographics | Rating | Rank | Female Poverty Among 25-34 Year Olds |
| Immigrants | Nonimmigrants | 0.1 /100 | #273 | Tragic 15.6% |
| Immigrants | Caribbean | 0.0 /100 | #274 | Tragic 15.7% |
| Immigrants | Azores | 0.0 /100 | #275 | Tragic 15.8% |
| Immigrants | Zaire | 0.0 /100 | #276 | Tragic 15.8% |
| Immigrants | Micronesia | 0.0 /100 | #277 | Tragic 15.8% |
| French American Indians | 0.0 /100 | #278 | Tragic 15.9% |
| Fijians | 0.0 /100 | #279 | Tragic 15.9% |
| Bangladeshis | 0.0 /100 | #280 | Tragic 15.9% |
| Immigrants | Latin America | 0.0 /100 | #281 | Tragic 16.0% |
| Aleuts | 0.0 /100 | #282 | Tragic 16.1% |
| Bahamians | 0.0 /100 | #283 | Tragic 16.1% |
| Shoshone | 0.0 /100 | #284 | Tragic 16.2% |
| Immigrants | Bahamas | 0.0 /100 | #285 | Tragic 16.3% |
| Cape Verdeans | 0.0 /100 | #286 | Tragic 16.3% |
| Americans | 0.0 /100 | #287 | Tragic 16.4% |
| Guatemalans | 0.0 /100 | #288 | Tragic 16.4% |
| Osage | 0.0 /100 | #289 | Tragic 16.4% |
| Indonesians | 0.0 /100 | #290 | Tragic 16.4% |
| Comanche | 0.0 /100 | #291 | Tragic 16.5% |
| Immigrants | Dominica | 0.0 /100 | #292 | Tragic 16.5% |
| Potawatomi | 0.0 /100 | #293 | Tragic 16.5% |