Portuguese vs Immigrants from Laos Seniors Poverty Over the Age of 75
COMPARE
Portuguese
Immigrants from Laos
Seniors Poverty Over the Age of 75
Seniors Poverty Over the Age of 75 Comparison
Portuguese
Immigrants from Laos
12.1%
SENIORS POVERTY OVER THE AGE OF 75
61.3/ 100
METRIC RATING
158th/ 347
METRIC RANK
12.0%
SENIORS POVERTY OVER THE AGE OF 75
71.5/ 100
METRIC RATING
142nd/ 347
METRIC RANK
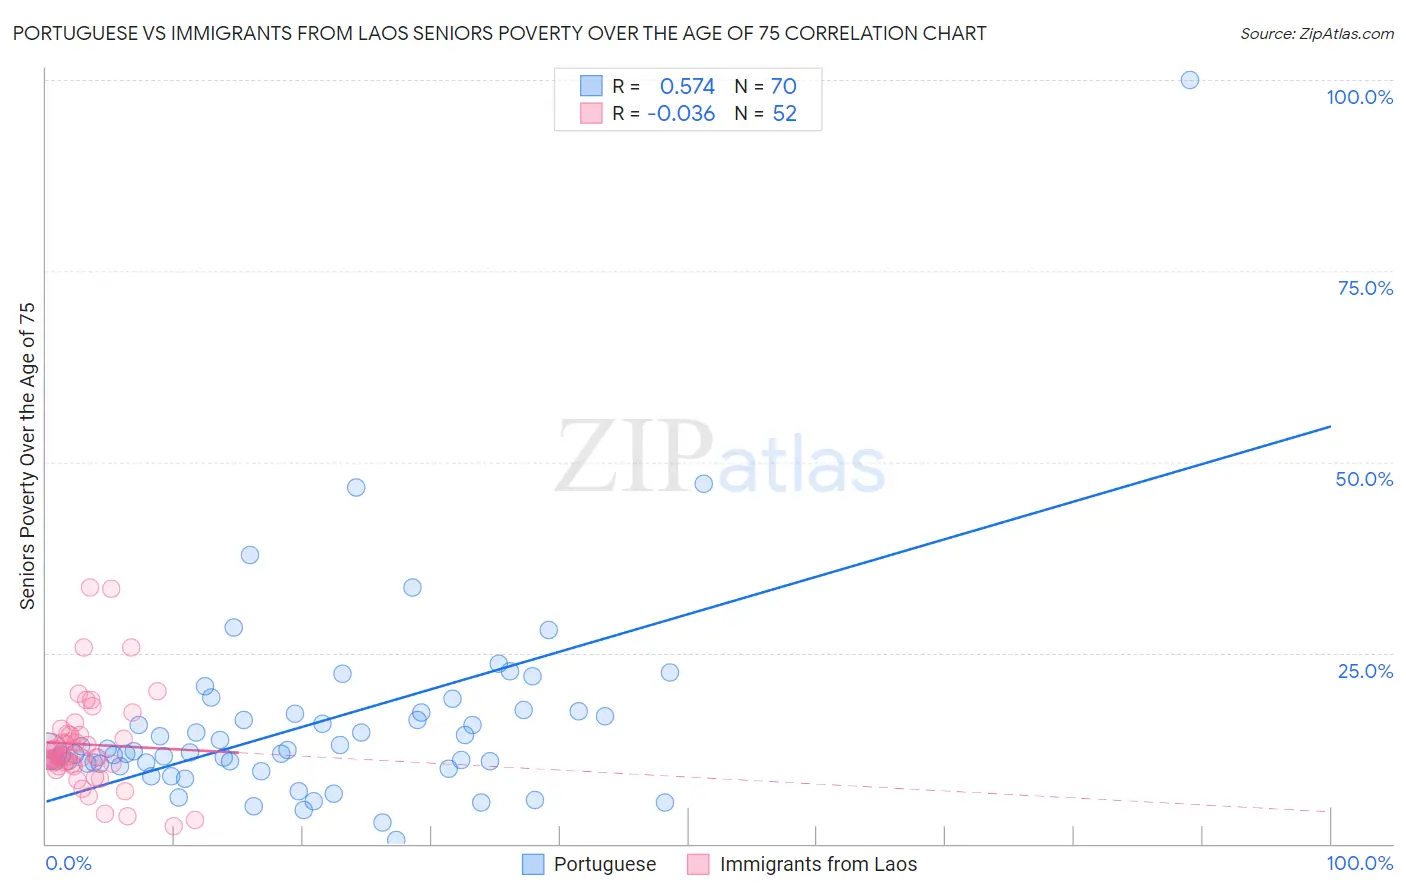
Portuguese vs Immigrants from Laos Seniors Poverty Over the Age of 75 Correlation Chart
The statistical analysis conducted on geographies consisting of 442,883,774 people shows a substantial positive correlation between the proportion of Portuguese and poverty level among seniors over the age of 75 in the United States with a correlation coefficient (R) of 0.574 and weighted average of 12.1%. Similarly, the statistical analysis conducted on geographies consisting of 200,379,282 people shows no correlation between the proportion of Immigrants from Laos and poverty level among seniors over the age of 75 in the United States with a correlation coefficient (R) of -0.036 and weighted average of 12.0%, a difference of 0.95%.
Seniors Poverty Over the Age of 75 Correlation Summary
| Measurement | Portuguese | Immigrants from Laos |
| Minimum | 0.48% | 2.3% |
| Maximum | 100.0% | 33.6% |
| Range | 99.5% | 31.3% |
| Mean | 15.8% | 13.0% |
| Median | 12.2% | 11.4% |
| Interquartile 25% (IQ1) | 10.5% | 10.4% |
| Interquartile 75% (IQ3) | 17.1% | 14.3% |
| Interquartile Range (IQR) | 6.7% | 3.9% |
| Standard Deviation (Sample) | 13.4% | 6.3% |
| Standard Deviation (Population) | 13.3% | 6.2% |
Demographics Similar to Portuguese and Immigrants from Laos by Seniors Poverty Over the Age of 75
In terms of seniors poverty over the age of 75, the demographic groups most similar to Portuguese are Immigrants from Middle Africa (12.1%, a difference of 0.010%), Immigrants from Eastern Africa (12.1%, a difference of 0.030%), Immigrants from Sudan (12.1%, a difference of 0.040%), Immigrants from Burma/Myanmar (12.1%, a difference of 0.090%), and Indonesian (12.1%, a difference of 0.12%). Similarly, the demographic groups most similar to Immigrants from Laos are Immigrants from Cameroon (12.0%, a difference of 0.030%), Immigrants from Pakistan (12.0%, a difference of 0.040%), American (12.0%, a difference of 0.050%), Hmong (12.0%, a difference of 0.060%), and Immigrants from Belgium (12.0%, a difference of 0.060%).
| Demographics | Rating | Rank | Seniors Poverty Over the Age of 75 |
| Immigrants | Pakistan | 71.9 /100 | #140 | Good 12.0% |
| Immigrants | Cameroon | 71.7 /100 | #141 | Good 12.0% |
| Immigrants | Laos | 71.5 /100 | #142 | Good 12.0% |
| Americans | 71.0 /100 | #143 | Good 12.0% |
| Hmong | 70.8 /100 | #144 | Good 12.0% |
| Immigrants | Belgium | 70.8 /100 | #145 | Good 12.0% |
| Bangladeshis | 70.4 /100 | #146 | Good 12.0% |
| Immigrants | Latvia | 69.1 /100 | #147 | Good 12.0% |
| Immigrants | Zaire | 67.6 /100 | #148 | Good 12.0% |
| Asians | 67.4 /100 | #149 | Good 12.0% |
| Cypriots | 67.3 /100 | #150 | Good 12.0% |
| Cherokee | 65.8 /100 | #151 | Good 12.0% |
| Immigrants | Korea | 65.5 /100 | #152 | Good 12.0% |
| Immigrants | Turkey | 64.7 /100 | #153 | Good 12.0% |
| Cambodians | 64.0 /100 | #154 | Good 12.0% |
| Indonesians | 62.6 /100 | #155 | Good 12.1% |
| Immigrants | Burma/Myanmar | 62.3 /100 | #156 | Good 12.1% |
| Immigrants | Sudan | 61.7 /100 | #157 | Good 12.1% |
| Portuguese | 61.3 /100 | #158 | Good 12.1% |
| Immigrants | Middle Africa | 61.2 /100 | #159 | Good 12.1% |
| Immigrants | Eastern Africa | 60.9 /100 | #160 | Good 12.1% |