Portuguese vs Immigrants from Caribbean Child Poverty Under the Age of 5
COMPARE
Portuguese
Immigrants from Caribbean
Child Poverty Under the Age of 5
Child Poverty Under the Age of 5 Comparison
Portuguese
Immigrants from Caribbean
16.5%
CHILD POVERTY UNDER THE AGE OF 5
83.0/ 100
METRIC RATING
142nd/ 347
METRIC RANK
21.4%
CHILD POVERTY UNDER THE AGE OF 5
0.0/ 100
METRIC RATING
290th/ 347
METRIC RANK
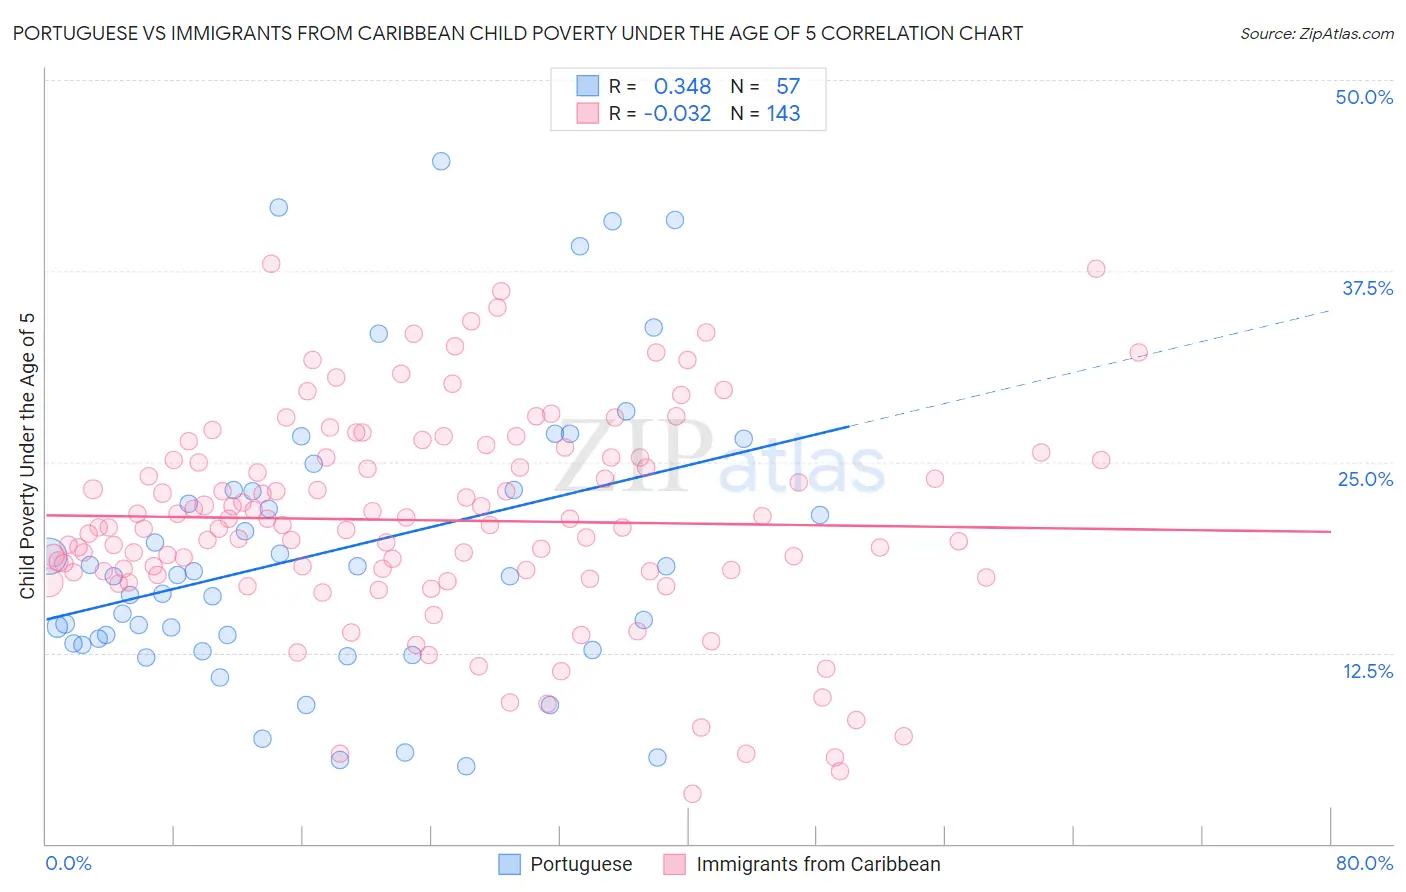
Portuguese vs Immigrants from Caribbean Child Poverty Under the Age of 5 Correlation Chart
The statistical analysis conducted on geographies consisting of 426,968,187 people shows a mild positive correlation between the proportion of Portuguese and poverty level among children under the age of 5 in the United States with a correlation coefficient (R) of 0.348 and weighted average of 16.5%. Similarly, the statistical analysis conducted on geographies consisting of 429,670,121 people shows no correlation between the proportion of Immigrants from Caribbean and poverty level among children under the age of 5 in the United States with a correlation coefficient (R) of -0.032 and weighted average of 21.4%, a difference of 29.5%.
Child Poverty Under the Age of 5 Correlation Summary
| Measurement | Portuguese | Immigrants from Caribbean |
| Minimum | 5.1% | 3.3% |
| Maximum | 44.7% | 38.0% |
| Range | 39.6% | 34.7% |
| Mean | 19.2% | 21.2% |
| Median | 17.5% | 20.8% |
| Interquartile 25% (IQ1) | 13.0% | 17.8% |
| Interquartile 75% (IQ3) | 23.2% | 25.3% |
| Interquartile Range (IQR) | 10.1% | 7.5% |
| Standard Deviation (Sample) | 9.5% | 6.9% |
| Standard Deviation (Population) | 9.4% | 6.8% |
Similar Demographics by Child Poverty Under the Age of 5
Demographics Similar to Portuguese by Child Poverty Under the Age of 5
In terms of child poverty under the age of 5, the demographic groups most similar to Portuguese are Samoan (16.5%, a difference of 0.010%), Immigrants from Western Europe (16.5%, a difference of 0.040%), Ethiopian (16.5%, a difference of 0.070%), Immigrants from Ethiopia (16.6%, a difference of 0.18%), and Israeli (16.6%, a difference of 0.19%).
| Demographics | Rating | Rank | Child Poverty Under the Age of 5 |
| Brazilians | 87.8 /100 | #135 | Excellent 16.4% |
| Immigrants | Northern Africa | 87.5 /100 | #136 | Excellent 16.4% |
| Immigrants | Chile | 85.3 /100 | #137 | Excellent 16.4% |
| Germans | 84.8 /100 | #138 | Excellent 16.5% |
| Immigrants | Hungary | 84.5 /100 | #139 | Excellent 16.5% |
| Guamanians/Chamorros | 84.2 /100 | #140 | Excellent 16.5% |
| Immigrants | Western Europe | 83.3 /100 | #141 | Excellent 16.5% |
| Portuguese | 83.0 /100 | #142 | Excellent 16.5% |
| Samoans | 83.0 /100 | #143 | Excellent 16.5% |
| Ethiopians | 82.7 /100 | #144 | Excellent 16.5% |
| Immigrants | Ethiopia | 82.1 /100 | #145 | Excellent 16.6% |
| Israelis | 82.0 /100 | #146 | Excellent 16.6% |
| Immigrants | Nepal | 80.3 /100 | #147 | Excellent 16.6% |
| Syrians | 79.1 /100 | #148 | Good 16.6% |
| New Zealanders | 78.7 /100 | #149 | Good 16.6% |
Demographics Similar to Immigrants from Caribbean by Child Poverty Under the Age of 5
In terms of child poverty under the age of 5, the demographic groups most similar to Immigrants from Caribbean are British West Indian (21.4%, a difference of 0.17%), Immigrants from Haiti (21.3%, a difference of 0.41%), Immigrants from Senegal (21.3%, a difference of 0.48%), Immigrants from Zaire (21.3%, a difference of 0.65%), and Immigrants from Latin America (21.2%, a difference of 0.75%).
| Demographics | Rating | Rank | Child Poverty Under the Age of 5 |
| Comanche | 0.0 /100 | #283 | Tragic 21.0% |
| Somalis | 0.0 /100 | #284 | Tragic 21.1% |
| Haitians | 0.0 /100 | #285 | Tragic 21.2% |
| Immigrants | Latin America | 0.0 /100 | #286 | Tragic 21.2% |
| Immigrants | Zaire | 0.0 /100 | #287 | Tragic 21.3% |
| Immigrants | Senegal | 0.0 /100 | #288 | Tragic 21.3% |
| Immigrants | Haiti | 0.0 /100 | #289 | Tragic 21.3% |
| Immigrants | Caribbean | 0.0 /100 | #290 | Tragic 21.4% |
| British West Indians | 0.0 /100 | #291 | Tragic 21.4% |
| Immigrants | Somalia | 0.0 /100 | #292 | Tragic 21.6% |
| Mexicans | 0.0 /100 | #293 | Tragic 21.6% |
| Guatemalans | 0.0 /100 | #294 | Tragic 21.6% |
| Cherokee | 0.0 /100 | #295 | Tragic 21.7% |
| Yaqui | 0.0 /100 | #296 | Tragic 21.7% |
| Hispanics or Latinos | 0.0 /100 | #297 | Tragic 21.7% |