Polish vs Immigrants from Venezuela Single Female Poverty
COMPARE
Polish
Immigrants from Venezuela
Single Female Poverty
Single Female Poverty Comparison
Poles
Immigrants from Venezuela
20.0%
SINGLE FEMALE POVERTY
95.6/ 100
METRIC RATING
117th/ 347
METRIC RANK
20.2%
SINGLE FEMALE POVERTY
91.5/ 100
METRIC RATING
134th/ 347
METRIC RANK
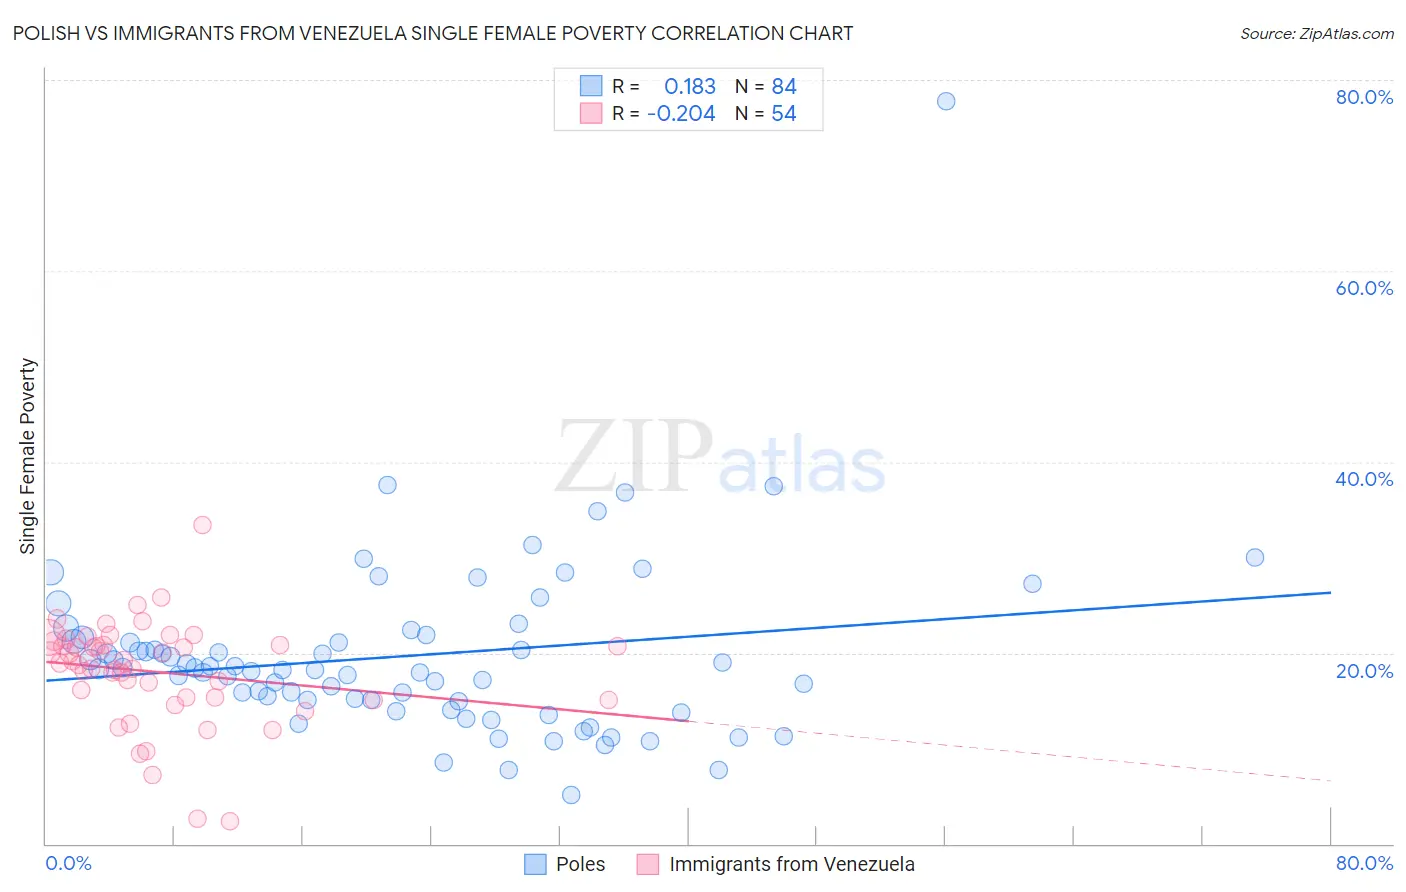
Polish vs Immigrants from Venezuela Single Female Poverty Correlation Chart
The statistical analysis conducted on geographies consisting of 540,648,270 people shows a poor positive correlation between the proportion of Poles and poverty level among single females in the United States with a correlation coefficient (R) of 0.183 and weighted average of 20.0%. Similarly, the statistical analysis conducted on geographies consisting of 285,137,962 people shows a weak negative correlation between the proportion of Immigrants from Venezuela and poverty level among single females in the United States with a correlation coefficient (R) of -0.204 and weighted average of 20.2%, a difference of 1.1%.
Single Female Poverty Correlation Summary
| Measurement | Polish | Immigrants from Venezuela |
| Minimum | 5.1% | 2.3% |
| Maximum | 77.8% | 33.4% |
| Range | 72.7% | 31.0% |
| Mean | 19.6% | 18.0% |
| Median | 18.3% | 19.0% |
| Interquartile 25% (IQ1) | 15.0% | 15.3% |
| Interquartile 75% (IQ3) | 21.4% | 20.8% |
| Interquartile Range (IQR) | 6.4% | 5.5% |
| Standard Deviation (Sample) | 9.3% | 5.4% |
| Standard Deviation (Population) | 9.3% | 5.4% |
Demographics Similar to Poles and Immigrants from Venezuela by Single Female Poverty
In terms of single female poverty, the demographic groups most similar to Poles are Immigrants from Kazakhstan (20.0%, a difference of 0.050%), Immigrants from Northern Africa (20.0%, a difference of 0.080%), Immigrants from Afghanistan (20.0%, a difference of 0.080%), Immigrants from Ethiopia (20.0%, a difference of 0.080%), and South American (20.0%, a difference of 0.17%). Similarly, the demographic groups most similar to Immigrants from Venezuela are Immigrants from Iraq (20.2%, a difference of 0.050%), Immigrants from England (20.2%, a difference of 0.090%), Pakistani (20.2%, a difference of 0.12%), Uruguayan (20.2%, a difference of 0.12%), and Immigrants from Hungary (20.2%, a difference of 0.18%).
| Demographics | Rating | Rank | Single Female Poverty |
| Immigrants | Northern Africa | 95.8 /100 | #115 | Exceptional 20.0% |
| Immigrants | Kazakhstan | 95.7 /100 | #116 | Exceptional 20.0% |
| Poles | 95.6 /100 | #117 | Exceptional 20.0% |
| Immigrants | Afghanistan | 95.4 /100 | #118 | Exceptional 20.0% |
| Immigrants | Ethiopia | 95.4 /100 | #119 | Exceptional 20.0% |
| South Americans | 95.1 /100 | #120 | Exceptional 20.0% |
| Immigrants | Switzerland | 95.1 /100 | #121 | Exceptional 20.0% |
| Immigrants | South America | 95.0 /100 | #122 | Exceptional 20.0% |
| Brazilians | 94.4 /100 | #123 | Exceptional 20.1% |
| Immigrants | Chile | 94.3 /100 | #124 | Exceptional 20.1% |
| Immigrants | South Africa | 93.9 /100 | #125 | Exceptional 20.1% |
| Serbians | 93.3 /100 | #126 | Exceptional 20.1% |
| Mongolians | 93.2 /100 | #127 | Exceptional 20.2% |
| Immigrants | Spain | 92.7 /100 | #128 | Exceptional 20.2% |
| Immigrants | Morocco | 92.4 /100 | #129 | Exceptional 20.2% |
| Immigrants | Hungary | 92.3 /100 | #130 | Exceptional 20.2% |
| Pakistanis | 92.1 /100 | #131 | Exceptional 20.2% |
| Uruguayans | 92.1 /100 | #132 | Exceptional 20.2% |
| Immigrants | England | 91.9 /100 | #133 | Exceptional 20.2% |
| Immigrants | Venezuela | 91.5 /100 | #134 | Exceptional 20.2% |
| Immigrants | Iraq | 91.2 /100 | #135 | Exceptional 20.2% |