Polish vs Immigrants from Grenada Single Mother Poverty

COMPARE

Polish
Race
Ancestry
AfghanAfricanAlaska NativeAlaskan AthabascanAlbanianAleutAlsatianAmericanApacheArabArapahoArgentineanArmenianAssyrian/Chaldean/SyriacAustralianAustrianBahamianBangladeshiBarbadianBasqueBelgianBelizeanBermudanBhutaneseBlackfeetBolivianBrazilianBritishBritish West IndianBulgarianBurmeseCajunCambodianCanadianCape VerdeanCarpatho RusynCelticCentral AmericanCentral American IndianCherokeeCheyenneChickasawChileanChineseChippewaChoctawColombianColvilleComancheCosta RicanCreeCreekCroatianCrowCubanCypriotCzechCzechoslovakianDanishDelawareDominicanDutchDutch West IndianEastern EuropeanEcuadorianEgyptianEnglishEstonianEthiopianEuropeanFijianFilipinoFinnishFrenchFrench American IndianFrench CanadianGermanGerman RussianGhanaianGreekGuamanian/ChamorroGuatemalanGuyaneseHaitianHmongHonduranHopiHoumaHungarianIcelanderIndian (Asian)IndonesianInupiatIranianIraqiIrishIroquoisIsraeliItalianJamaicanJapaneseJordanianKenyanKiowaKoreanLaotianLatvianLebaneseLiberianLithuanianLumbeeLuxembourgerMacedonianMalaysianMalteseMarshalleseMenomineeMexicanMexican American IndianMongolianMoroccanNative HawaiianNavajoNepaleseNew ZealanderNicaraguanNigerianNorthern EuropeanNorwegianOkinawanOsageOttawaPaiutePakistaniPalestinianPanamanianParaguayanPennsylvania GermanPeruvianPimaPolishPortuguesePotawatomiPuebloPuerto RicanPuget Sound SalishRomanianRussianSalvadoranSamoanScandinavianScotch-IrishScottishSeminoleSenegaleseSerbianShoshoneSierra LeoneanSiouxSlavicSlovakSloveneSomaliSouth AfricanSouth AmericanSouth American IndianSoviet UnionSpaniardSpanishSpanish AmericanSpanish American IndianSri LankanSubsaharan AfricanSudaneseSwedishSwissSyrianTaiwaneseThaiTlingit-HaidaTohono O'OdhamTonganTrinidadian and TobagonianTsimshianTurkishU.S. Virgin IslanderUgandanUkrainianUruguayanUteVenezuelanVietnameseWelshWest IndianYakamaYaquiYugoslavianYumanYup'ikZimbabwean
Immigration
NonimmigrantsImmigrantsAfghanistanAfricaAlbaniaArgentinaArmeniaAsiaAustraliaAustriaBahamasBangladeshBarbadosBelarusBelgiumBelizeBoliviaBosnia and HerzegovinaBrazilBulgariaBurma/MyanmarCabo VerdeCambodiaCameroonCanadaCaribbeanCentral AmericaChileChinaColombiaCongoCosta RicaCroatiaCubaCzechoslovakiaDenmarkDominicaDominican RepublicEastern AfricaEastern AsiaEastern EuropeEcuadorEgyptEl SalvadorEnglandEritreaEthiopiaEuropeFijiFranceGermanyGhanaGreeceGuatemalaGuyanaHaitiHondurasHong KongHungaryIndiaIndonesiaIranIraqIrelandIsraelItalyJamaicaJapanJordanKazakhstanKenyaKoreaKuwaitLaosLatin AmericaLatviaLebanonLiberiaLithuaniaMalaysiaMexicoMicronesiaMiddle AfricaMoldovaMoroccoNepalNetherlandsNicaraguaNigeriaNorth AmericaNorth MacedoniaNorthern AfricaNorthern EuropeNorwayOceaniaPakistanPanamaPeruPhilippinesPolandPortugalRomaniaRussiaSaudi ArabiaScotlandSenegalSerbiaSierra LeoneSingaporeSomaliaSouth AfricaSouth AmericaSouth Central AsiaSouth Eastern AsiaSouthern EuropeSpainSri LankaSt. Vincent and the GrenadinesSudanSwedenSwitzerlandSyriaTaiwanThailandTrinidad and TobagoTurkeyUgandaUkraineUruguayUzbekistanVenezuelaVietnamWest IndiesWestern AfricaWestern AsiaWestern EuropeYemenZaireZimbabweAzores
Immigrants from Grenada
Race
Ancestry
AfghanAfricanAlaska NativeAlaskan AthabascanAlbanianAleutAlsatianAmericanApacheArabArapahoArgentineanArmenianAssyrian/Chaldean/SyriacAustralianAustrianBahamianBangladeshiBarbadianBasqueBelgianBelizeanBermudanBhutaneseBlackfeetBolivianBrazilianBritishBritish West IndianBulgarianBurmeseCajunCambodianCanadianCape VerdeanCarpatho RusynCelticCentral AmericanCentral American IndianCherokeeCheyenneChickasawChileanChineseChippewaChoctawColombianColvilleComancheCosta RicanCreeCreekCroatianCrowCubanCypriotCzechCzechoslovakianDanishDelawareDominicanDutchDutch West IndianEastern EuropeanEcuadorianEgyptianEnglishEstonianEthiopianEuropeanFijianFilipinoFinnishFrenchFrench American IndianFrench CanadianGermanGerman RussianGhanaianGreekGuamanian/ChamorroGuatemalanGuyaneseHaitianHmongHonduranHopiHoumaHungarianIcelanderIndian (Asian)IndonesianInupiatIranianIraqiIrishIroquoisIsraeliItalianJamaicanJapaneseJordanianKenyanKiowaKoreanLaotianLatvianLebaneseLiberianLithuanianLumbeeLuxembourgerMacedonianMalaysianMalteseMarshalleseMenomineeMexicanMexican American IndianMongolianMoroccanNative HawaiianNavajoNepaleseNew ZealanderNicaraguanNigerianNorthern EuropeanNorwegianOkinawanOsageOttawaPaiutePakistaniPalestinianPanamanianParaguayanPennsylvania GermanPeruvianPimaPortuguesePotawatomiPuebloPuerto RicanPuget Sound SalishRomanianRussianSalvadoranSamoanScandinavianScotch-IrishScottishSeminoleSenegaleseSerbianShoshoneSierra LeoneanSiouxSlavicSlovakSloveneSomaliSouth AfricanSouth AmericanSouth American IndianSoviet UnionSpaniardSpanishSpanish AmericanSpanish American IndianSri LankanSubsaharan AfricanSudaneseSwedishSwissSyrianTaiwaneseThaiTlingit-HaidaTohono O'OdhamTonganTrinidadian and TobagonianTsimshianTurkishU.S. Virgin IslanderUgandanUkrainianUruguayanUteVenezuelanVietnameseWelshWest IndianYakamaYaquiYugoslavianYumanYup'ikZimbabwean
Immigration
NonimmigrantsImmigrantsAfghanistanAfricaAlbaniaArgentinaArmeniaAsiaAustraliaAustriaBahamasBangladeshBarbadosBelarusBelgiumBelizeBoliviaBosnia and HerzegovinaBrazilBulgariaBurma/MyanmarCabo VerdeCambodiaCameroonCanadaCaribbeanCentral AmericaChileChinaColombiaCongoCosta RicaCroatiaCubaCzechoslovakiaDenmarkDominicaDominican RepublicEastern AfricaEastern AsiaEastern EuropeEcuadorEgyptEl SalvadorEnglandEritreaEthiopiaEuropeFijiFranceGermanyGhanaGreeceGrenadaGuatemalaGuyanaHaitiHondurasHong KongHungaryIndiaIndonesiaIranIraqIrelandIsraelItalyJamaicaJapanJordanKazakhstanKenyaKoreaKuwaitLaosLatin AmericaLatviaLebanonLiberiaLithuaniaMalaysiaMexicoMicronesiaMiddle AfricaMoldovaMoroccoNepalNetherlandsNicaraguaNigeriaNorth AmericaNorth MacedoniaNorthern AfricaNorthern EuropeNorwayOceaniaPakistanPanamaPeruPhilippinesPolandPortugalRomaniaRussiaSaudi ArabiaScotlandSenegalSerbiaSierra LeoneSingaporeSomaliaSouth AfricaSouth AmericaSouth Central AsiaSouth Eastern AsiaSouthern EuropeSpainSri LankaSt. Vincent and the GrenadinesSudanSwedenSwitzerlandSyriaTaiwanThailandTrinidad and TobagoTurkeyUgandaUkraineUruguayUzbekistanVenezuelaVietnamWest IndiesWestern AfricaWestern AsiaWestern EuropeYemenZaireZimbabweAzores
Single Mother Poverty
Income
Poverty
Unemployment
Labor Participation
Family Structure
Vehicle Availability
Education Level
Disability

Single Mother Poverty Comparison

Poles

Immigrants from Grenada

Exceptional
Tragic
28.4%
SINGLE MOTHER POVERTY
90.8/ 100
METRIC RATING
127th/ 347
METRIC RANK
30.3%
SINGLE MOTHER POVERTY
3.4/ 100
METRIC RATING
235th/ 347
METRIC RANK

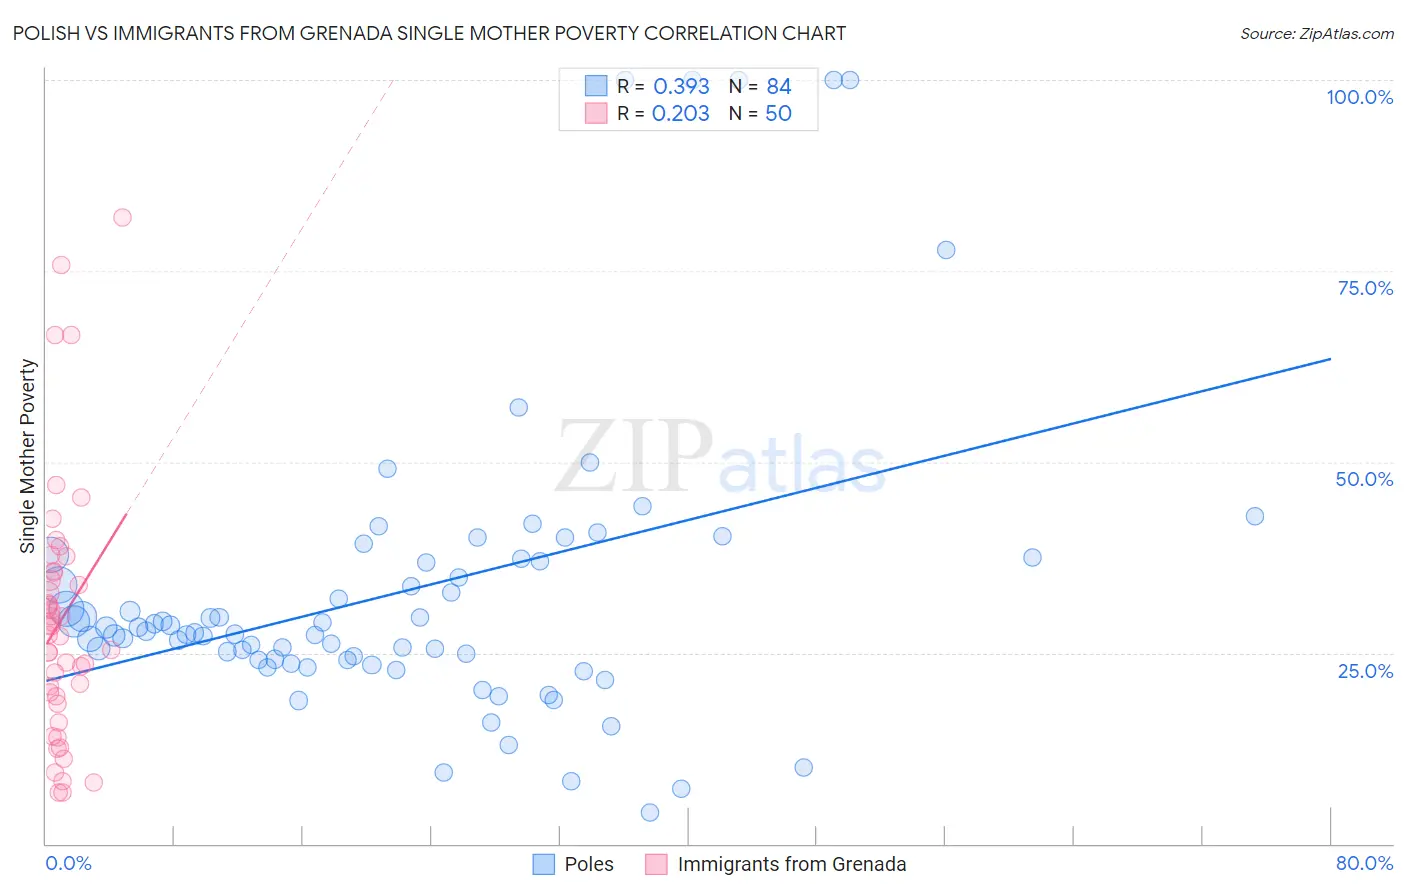
Polish vs Immigrants from Grenada Single Mother Poverty Correlation Chart

The statistical analysis conducted on geographies consisting of 533,048,223 people shows a mild positive correlation between the proportion of Poles and poverty level among single mothers in the United States with a correlation coefficient (R) of 0.393 and weighted average of 28.4%. Similarly, the statistical analysis conducted on geographies consisting of 66,826,476 people shows a weak positive correlation between the proportion of Immigrants from Grenada and poverty level among single mothers in the United States with a correlation coefficient (R) of 0.203 and weighted average of 30.3%, a difference of 6.9%.
Polish vs Immigrants from Grenada Single Mother Poverty

Single Mother Poverty Correlation Summary

MeasurementPolishImmigrants from Grenada
Minimum4.1%6.6%
Maximum100.0%82.1%
Range95.9%75.4%
Mean33.1%29.3%
Median27.7%27.9%
Interquartile 25% (IQ1)24.1%19.2%
Interquartile 75% (IQ3)37.2%35.5%
Interquartile Range (IQR)13.1%16.3%
Standard Deviation (Sample)20.1%16.6%
Standard Deviation (Population)20.0%16.4%

Similar Demographics by Single Mother Poverty

Demographics Similar to Poles by Single Mother Poverty

In terms of single mother poverty, the demographic groups most similar to Poles are Immigrants from Chile (28.4%, a difference of 0.010%), Kenyan (28.4%, a difference of 0.020%), Immigrants from England (28.4%, a difference of 0.030%), South American (28.4%, a difference of 0.060%), and Norwegian (28.4%, a difference of 0.060%).
DemographicsRating | RankSingle Mother Poverty
Cypriots
92.3
/100
|
#120
Exceptional
28.3%
Immigrants | Afghanistan
92.1
/100
|
#121
Exceptional
28.3%
Colombians
91.8
/100
|
#122
Exceptional
28.3%
Uruguayans
91.7
/100
|
#123
Exceptional
28.3%
Immigrants | Switzerland
91.7
/100
|
#124
Exceptional
28.3%
Kenyans
90.9
/100
|
#125
Exceptional
28.4%
Immigrants | Chile
90.8
/100
|
#126
Exceptional
28.4%
Poles
90.8
/100
|
#127
Exceptional
28.4%
Immigrants | England
90.5
/100
|
#128
Exceptional
28.4%
South Americans
90.4
/100
|
#129
Exceptional
28.4%
Norwegians
90.4
/100
|
#130
Exceptional
28.4%
Immigrants | Austria
90.3
/100
|
#131
Exceptional
28.4%
Immigrants | Morocco
89.5
/100
|
#132
Excellent
28.4%
Swedes
89.4
/100
|
#133
Excellent
28.4%
Immigrants | Southern Europe
89.2
/100
|
#134
Excellent
28.4%

Demographics Similar to Immigrants from Grenada by Single Mother Poverty

In terms of single mother poverty, the demographic groups most similar to Immigrants from Grenada are Immigrants from Middle Africa (30.3%, a difference of 0.030%), Immigrants from Nicaragua (30.3%, a difference of 0.030%), Welsh (30.4%, a difference of 0.070%), Immigrants from St. Vincent and the Grenadines (30.4%, a difference of 0.12%), and Slovak (30.4%, a difference of 0.23%).
DemographicsRating | RankSingle Mother Poverty
Spaniards
5.4
/100
|
#228
Tragic
30.2%
Immigrants | Barbados
5.0
/100
|
#229
Tragic
30.2%
English
4.8
/100
|
#230
Tragic
30.2%
Dutch
4.3
/100
|
#231
Tragic
30.2%
Alaskan Athabascans
4.1
/100
|
#232
Tragic
30.3%
Immigrants | Middle Africa
3.5
/100
|
#233
Tragic
30.3%
Immigrants | Nicaragua
3.5
/100
|
#234
Tragic
30.3%
Immigrants | Grenada
3.4
/100
|
#235
Tragic
30.3%
Welsh
3.2
/100
|
#236
Tragic
30.4%
Immigrants | St. Vincent and the Grenadines
3.1
/100
|
#237
Tragic
30.4%
Slovaks
2.8
/100
|
#238
Tragic
30.4%
Immigrants | Portugal
2.1
/100
|
#239
Tragic
30.5%
Salvadorans
1.8
/100
|
#240
Tragic
30.6%
Immigrants | Laos
1.8
/100
|
#241
Tragic
30.6%
Immigrants | Burma/Myanmar
1.7
/100
|
#242
Tragic
30.6%