Polish vs Immigrants from Afghanistan Female Poverty Among 25-34 Year Olds
COMPARE
Polish
Immigrants from Afghanistan
Female Poverty Among 25-34 Year Olds
Female Poverty Among 25-34 Year Olds Comparison
Poles
Immigrants from Afghanistan
12.7%
FEMALE POVERTY AMONG 25-34 YEAR OLDS
94.9/ 100
METRIC RATING
107th/ 347
METRIC RANK
13.4%
FEMALE POVERTY AMONG 25-34 YEAR OLDS
57.7/ 100
METRIC RATING
168th/ 347
METRIC RANK
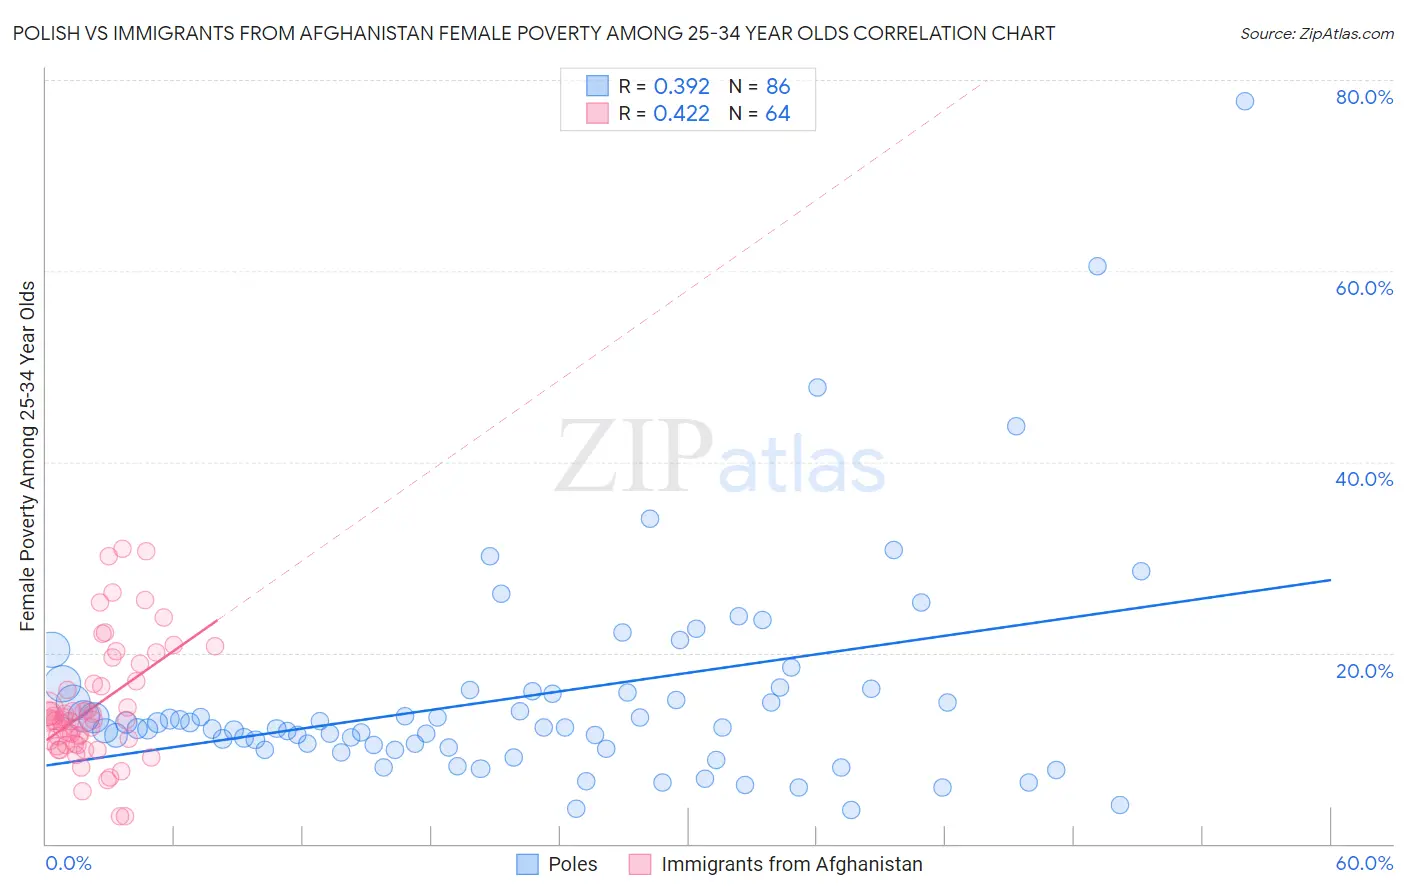
Polish vs Immigrants from Afghanistan Female Poverty Among 25-34 Year Olds Correlation Chart
The statistical analysis conducted on geographies consisting of 539,020,076 people shows a mild positive correlation between the proportion of Poles and poverty level among females between the ages 25 and 34 in the United States with a correlation coefficient (R) of 0.392 and weighted average of 12.7%. Similarly, the statistical analysis conducted on geographies consisting of 146,726,984 people shows a moderate positive correlation between the proportion of Immigrants from Afghanistan and poverty level among females between the ages 25 and 34 in the United States with a correlation coefficient (R) of 0.422 and weighted average of 13.4%, a difference of 5.8%.
Female Poverty Among 25-34 Year Olds Correlation Summary
| Measurement | Polish | Immigrants from Afghanistan |
| Minimum | 3.5% | 2.8% |
| Maximum | 77.8% | 30.9% |
| Range | 74.2% | 28.1% |
| Mean | 15.4% | 14.4% |
| Median | 12.2% | 12.9% |
| Interquartile 25% (IQ1) | 10.0% | 10.4% |
| Interquartile 75% (IQ3) | 15.9% | 16.9% |
| Interquartile Range (IQR) | 5.9% | 6.4% |
| Standard Deviation (Sample) | 11.5% | 6.2% |
| Standard Deviation (Population) | 11.4% | 6.2% |
Similar Demographics by Female Poverty Among 25-34 Year Olds
Demographics Similar to Poles by Female Poverty Among 25-34 Year Olds
In terms of female poverty among 25-34 year olds, the demographic groups most similar to Poles are Tsimshian (12.7%, a difference of 0.050%), Immigrants from South Africa (12.7%, a difference of 0.15%), Swedish (12.7%, a difference of 0.20%), Immigrants from Spain (12.7%, a difference of 0.25%), and Immigrants from Norway (12.7%, a difference of 0.25%).
| Demographics | Rating | Rank | Female Poverty Among 25-34 Year Olds |
| Immigrants | Denmark | 95.7 /100 | #100 | Exceptional 12.7% |
| Immigrants | Switzerland | 95.7 /100 | #101 | Exceptional 12.7% |
| Peruvians | 95.6 /100 | #102 | Exceptional 12.7% |
| Immigrants | Spain | 95.5 /100 | #103 | Exceptional 12.7% |
| Swedes | 95.4 /100 | #104 | Exceptional 12.7% |
| Immigrants | South Africa | 95.3 /100 | #105 | Exceptional 12.7% |
| Tsimshian | 95.1 /100 | #106 | Exceptional 12.7% |
| Poles | 94.9 /100 | #107 | Exceptional 12.7% |
| Immigrants | Norway | 94.4 /100 | #108 | Exceptional 12.7% |
| Immigrants | Peru | 94.3 /100 | #109 | Exceptional 12.7% |
| Australians | 94.1 /100 | #110 | Exceptional 12.8% |
| Danes | 93.9 /100 | #111 | Exceptional 12.8% |
| Immigrants | Morocco | 93.9 /100 | #112 | Exceptional 12.8% |
| Immigrants | Syria | 93.8 /100 | #113 | Exceptional 12.8% |
| Immigrants | Southern Europe | 93.6 /100 | #114 | Exceptional 12.8% |
Demographics Similar to Immigrants from Afghanistan by Female Poverty Among 25-34 Year Olds
In terms of female poverty among 25-34 year olds, the demographic groups most similar to Immigrants from Afghanistan are Immigrants from Bosnia and Herzegovina (13.4%, a difference of 0.080%), Samoan (13.5%, a difference of 0.080%), Belgian (13.4%, a difference of 0.10%), Basque (13.4%, a difference of 0.14%), and Swiss (13.4%, a difference of 0.35%).
| Demographics | Rating | Rank | Female Poverty Among 25-34 Year Olds |
| Icelanders | 65.7 /100 | #161 | Good 13.3% |
| Ugandans | 64.1 /100 | #162 | Good 13.4% |
| British | 63.5 /100 | #163 | Good 13.4% |
| Swiss | 61.7 /100 | #164 | Good 13.4% |
| Basques | 59.3 /100 | #165 | Average 13.4% |
| Belgians | 58.9 /100 | #166 | Average 13.4% |
| Immigrants | Bosnia and Herzegovina | 58.6 /100 | #167 | Average 13.4% |
| Immigrants | Afghanistan | 57.7 /100 | #168 | Average 13.4% |
| Samoans | 56.8 /100 | #169 | Average 13.5% |
| Immigrants | Uganda | 53.0 /100 | #170 | Average 13.5% |
| South American Indians | 51.9 /100 | #171 | Average 13.5% |
| Immigrants | Costa Rica | 51.9 /100 | #172 | Average 13.5% |
| Kenyans | 51.8 /100 | #173 | Average 13.5% |
| Immigrants | Oceania | 50.0 /100 | #174 | Average 13.5% |
| Bermudans | 46.8 /100 | #175 | Average 13.6% |