Pima vs Immigrants from Sierra Leone Child Poverty Under the Age of 16

COMPARE

Pima
Race
Ancestry
AfghanAfricanAlaska NativeAlaskan AthabascanAlbanianAleutAlsatianAmericanApacheArabArapahoArgentineanArmenianAssyrian/Chaldean/SyriacAustralianAustrianBahamianBangladeshiBarbadianBasqueBelgianBelizeanBermudanBhutaneseBlackfeetBolivianBrazilianBritishBritish West IndianBulgarianBurmeseCajunCambodianCanadianCape VerdeanCarpatho RusynCelticCentral AmericanCentral American IndianCherokeeCheyenneChickasawChileanChineseChippewaChoctawColombianColvilleComancheCosta RicanCreeCreekCroatianCrowCubanCypriotCzechCzechoslovakianDanishDelawareDominicanDutchDutch West IndianEastern EuropeanEcuadorianEgyptianEnglishEstonianEthiopianEuropeanFijianFilipinoFinnishFrenchFrench American IndianFrench CanadianGermanGerman RussianGhanaianGreekGuamanian/ChamorroGuatemalanGuyaneseHaitianHmongHonduranHopiHoumaHungarianIcelanderIndian (Asian)IndonesianInupiatIranianIraqiIrishIroquoisIsraeliItalianJamaicanJapaneseJordanianKenyanKiowaKoreanLaotianLatvianLebaneseLiberianLithuanianLumbeeLuxembourgerMacedonianMalaysianMalteseMarshalleseMenomineeMexicanMexican American IndianMongolianMoroccanNative HawaiianNavajoNepaleseNew ZealanderNicaraguanNigerianNorthern EuropeanNorwegianOkinawanOsageOttawaPaiutePakistaniPalestinianPanamanianParaguayanPennsylvania GermanPeruvianPimaPolishPortuguesePotawatomiPuebloPuerto RicanPuget Sound SalishRomanianRussianSalvadoranSamoanScandinavianScotch-IrishScottishSeminoleSenegaleseSerbianShoshoneSierra LeoneanSiouxSlavicSlovakSloveneSomaliSouth AfricanSouth AmericanSouth American IndianSoviet UnionSpaniardSpanishSpanish AmericanSpanish American IndianSri LankanSubsaharan AfricanSudaneseSwedishSwissSyrianTaiwaneseThaiTlingit-HaidaTohono O'OdhamTonganTrinidadian and TobagonianTsimshianTurkishU.S. Virgin IslanderUgandanUkrainianUruguayanUteVenezuelanVietnameseWelshWest IndianYakamaYaquiYugoslavianYumanYup'ikZimbabwean
Immigration
NonimmigrantsImmigrantsAfghanistanAfricaAlbaniaArgentinaArmeniaAsiaAustraliaAustriaBahamasBangladeshBarbadosBelarusBelgiumBelizeBoliviaBosnia and HerzegovinaBrazilBulgariaBurma/MyanmarCabo VerdeCambodiaCameroonCanadaCaribbeanCentral AmericaChileChinaColombiaCongoCosta RicaCroatiaCubaCzechoslovakiaDenmarkDominicaDominican RepublicEastern AfricaEastern AsiaEastern EuropeEcuadorEgyptEl SalvadorEnglandEritreaEthiopiaEuropeFijiFranceGermanyGhanaGreeceGrenadaGuatemalaGuyanaHaitiHondurasHong KongHungaryIndiaIndonesiaIranIraqIrelandIsraelItalyJamaicaJapanJordanKazakhstanKenyaKoreaKuwaitLaosLatin AmericaLatviaLebanonLiberiaLithuaniaMalaysiaMexicoMicronesiaMiddle AfricaMoldovaMoroccoNepalNetherlandsNicaraguaNigeriaNorth AmericaNorth MacedoniaNorthern AfricaNorthern EuropeNorwayOceaniaPakistanPanamaPeruPhilippinesPolandPortugalRomaniaRussiaSaudi ArabiaScotlandSenegalSerbiaSingaporeSomaliaSouth AfricaSouth AmericaSouth Central AsiaSouth Eastern AsiaSouthern EuropeSpainSri LankaSt. Vincent and the GrenadinesSudanSwedenSwitzerlandSyriaTaiwanThailandTrinidad and TobagoTurkeyUgandaUkraineUruguayUzbekistanVenezuelaVietnamWest IndiesWestern AfricaWestern AsiaWestern EuropeYemenZaireZimbabweAzores
Immigrants from Sierra Leone
Race
Ancestry
AfghanAfricanAlaska NativeAlaskan AthabascanAlbanianAleutAlsatianAmericanApacheArabArapahoArgentineanArmenianAssyrian/Chaldean/SyriacAustralianAustrianBahamianBangladeshiBarbadianBasqueBelgianBelizeanBermudanBhutaneseBlackfeetBolivianBrazilianBritishBritish West IndianBulgarianBurmeseCajunCambodianCanadianCape VerdeanCarpatho RusynCelticCentral AmericanCentral American IndianCherokeeCheyenneChickasawChileanChineseChippewaChoctawColombianColvilleComancheCosta RicanCreeCreekCroatianCrowCubanCypriotCzechCzechoslovakianDanishDelawareDominicanDutchDutch West IndianEastern EuropeanEcuadorianEgyptianEnglishEstonianEthiopianEuropeanFijianFilipinoFinnishFrenchFrench American IndianFrench CanadianGermanGerman RussianGhanaianGreekGuamanian/ChamorroGuatemalanGuyaneseHaitianHmongHonduranHopiHoumaHungarianIcelanderIndian (Asian)IndonesianInupiatIranianIraqiIrishIroquoisIsraeliItalianJamaicanJapaneseJordanianKenyanKiowaKoreanLaotianLatvianLebaneseLiberianLithuanianLumbeeLuxembourgerMacedonianMalaysianMalteseMarshalleseMenomineeMexicanMexican American IndianMongolianMoroccanNative HawaiianNavajoNepaleseNew ZealanderNicaraguanNigerianNorthern EuropeanNorwegianOkinawanOsageOttawaPaiutePakistaniPalestinianPanamanianParaguayanPennsylvania GermanPeruvianPolishPortuguesePotawatomiPuebloPuerto RicanPuget Sound SalishRomanianRussianSalvadoranSamoanScandinavianScotch-IrishScottishSeminoleSenegaleseSerbianShoshoneSierra LeoneanSiouxSlavicSlovakSloveneSomaliSouth AfricanSouth AmericanSouth American IndianSoviet UnionSpaniardSpanishSpanish AmericanSpanish American IndianSri LankanSubsaharan AfricanSudaneseSwedishSwissSyrianTaiwaneseThaiTlingit-HaidaTohono O'OdhamTonganTrinidadian and TobagonianTsimshianTurkishU.S. Virgin IslanderUgandanUkrainianUruguayanUteVenezuelanVietnameseWelshWest IndianYakamaYaquiYugoslavianYumanYup'ikZimbabwean
Immigration
NonimmigrantsImmigrantsAfghanistanAfricaAlbaniaArgentinaArmeniaAsiaAustraliaAustriaBahamasBangladeshBarbadosBelarusBelgiumBelizeBoliviaBosnia and HerzegovinaBrazilBulgariaBurma/MyanmarCabo VerdeCambodiaCameroonCanadaCaribbeanCentral AmericaChileChinaColombiaCongoCosta RicaCroatiaCubaCzechoslovakiaDenmarkDominicaDominican RepublicEastern AfricaEastern AsiaEastern EuropeEcuadorEgyptEl SalvadorEnglandEritreaEthiopiaEuropeFijiFranceGermanyGhanaGreeceGrenadaGuatemalaGuyanaHaitiHondurasHong KongHungaryIndiaIndonesiaIranIraqIrelandIsraelItalyJamaicaJapanJordanKazakhstanKenyaKoreaKuwaitLaosLatin AmericaLatviaLebanonLiberiaLithuaniaMalaysiaMexicoMicronesiaMiddle AfricaMoldovaMoroccoNepalNetherlandsNicaraguaNigeriaNorth AmericaNorth MacedoniaNorthern AfricaNorthern EuropeNorwayOceaniaPakistanPanamaPeruPhilippinesPolandPortugalRomaniaRussiaSaudi ArabiaScotlandSenegalSerbiaSierra LeoneSingaporeSomaliaSouth AfricaSouth AmericaSouth Central AsiaSouth Eastern AsiaSouthern EuropeSpainSri LankaSt. Vincent and the GrenadinesSudanSwedenSwitzerlandSyriaTaiwanThailandTrinidad and TobagoTurkeyUgandaUkraineUruguayUzbekistanVenezuelaVietnamWest IndiesWestern AfricaWestern AsiaWestern EuropeYemenZaireZimbabweAzores
Child Poverty Under the Age of 16
Income
Poverty
Unemployment
Labor Participation
Family Structure
Vehicle Availability
Education Level
Disability

Child Poverty Under the Age of 16 Comparison

Pima

Immigrants from Sierra Leone

Tragic
Poor
29.0%
CHILD POVERTY UNDER THE AGE OF 16
0.0/ 100
METRIC RATING
342nd/ 347
METRIC RANK
17.1%
CHILD POVERTY UNDER THE AGE OF 16
14.2/ 100
METRIC RATING
203rd/ 347
METRIC RANK

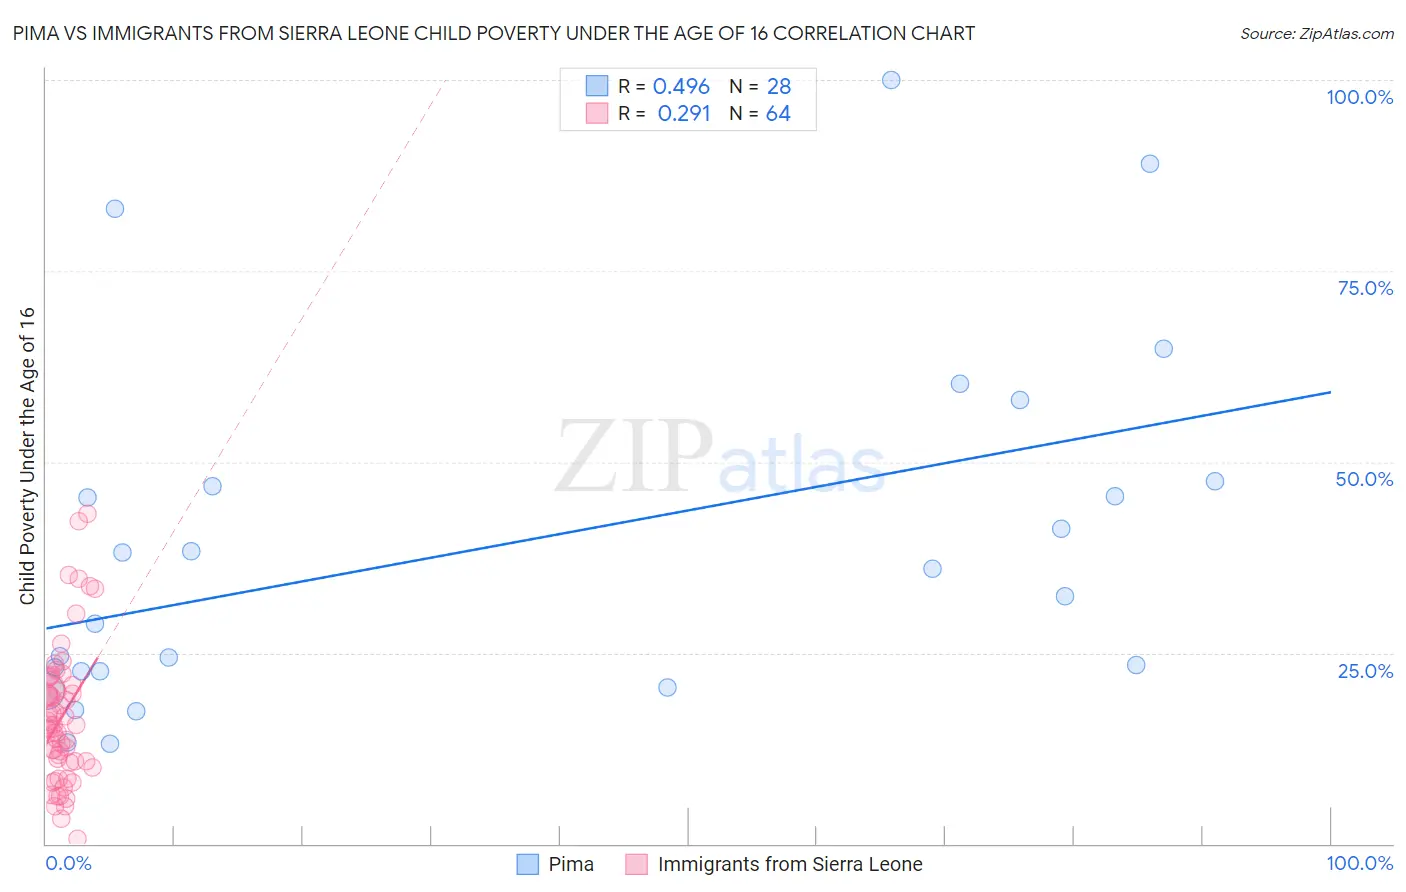
Pima vs Immigrants from Sierra Leone Child Poverty Under the Age of 16 Correlation Chart

The statistical analysis conducted on geographies consisting of 61,516,106 people shows a moderate positive correlation between the proportion of Pima and poverty level among children under the age of 16 in the United States with a correlation coefficient (R) of 0.496 and weighted average of 29.0%. Similarly, the statistical analysis conducted on geographies consisting of 101,506,912 people shows a weak positive correlation between the proportion of Immigrants from Sierra Leone and poverty level among children under the age of 16 in the United States with a correlation coefficient (R) of 0.291 and weighted average of 17.1%, a difference of 70.0%.
Pima vs Immigrants from Sierra Leone Child Poverty Under the Age of 16

Child Poverty Under the Age of 16 Correlation Summary

MeasurementPimaImmigrants from Sierra Leone
Minimum13.1%0.58%
Maximum100.0%43.1%
Range86.9%42.6%
Mean39.2%16.6%
Median34.2%15.5%
Interquartile 25% (IQ1)22.5%10.7%
Interquartile 75% (IQ3)47.1%20.5%
Interquartile Range (IQR)24.6%9.8%
Standard Deviation (Sample)23.2%9.0%
Standard Deviation (Population)22.7%9.0%

Similar Demographics by Child Poverty Under the Age of 16

Demographics Similar to Pima by Child Poverty Under the Age of 16

In terms of child poverty under the age of 16, the demographic groups most similar to Pima are Immigrants from Yemen (29.1%, a difference of 0.19%), Yuman (28.9%, a difference of 0.26%), Navajo (30.2%, a difference of 4.2%), Lumbee (31.0%, a difference of 6.8%), and Hopi (27.1%, a difference of 7.1%).
DemographicsRating | RankChild Poverty Under the Age of 16
Immigrants | Dominican Republic
0.0
/100
|
#333
Tragic
24.0%
Blacks/African Americans
0.0
/100
|
#334
Tragic
24.4%
Houma
0.0
/100
|
#335
Tragic
24.9%
Yup'ik
0.0
/100
|
#336
Tragic
25.1%
Sioux
0.0
/100
|
#337
Tragic
25.2%
Cheyenne
0.0
/100
|
#338
Tragic
25.4%
Crow
0.0
/100
|
#339
Tragic
26.0%
Hopi
0.0
/100
|
#340
Tragic
27.1%
Yuman
0.0
/100
|
#341
Tragic
28.9%
Pima
0.0
/100
|
#342
Tragic
29.0%
Immigrants | Yemen
0.0
/100
|
#343
Tragic
29.1%
Navajo
0.0
/100
|
#344
Tragic
30.2%
Lumbee
0.0
/100
|
#345
Tragic
31.0%
Tohono O'odham
0.0
/100
|
#346
Tragic
31.7%
Puerto Ricans
0.0
/100
|
#347
Tragic
32.5%

Demographics Similar to Immigrants from Sierra Leone by Child Poverty Under the Age of 16

In terms of child poverty under the age of 16, the demographic groups most similar to Immigrants from Sierra Leone are Ugandan (17.1%, a difference of 0.020%), Hmong (17.1%, a difference of 0.060%), Aleut (17.1%, a difference of 0.070%), Immigrants from Uzbekistan (17.1%, a difference of 0.10%), and Immigrants from Cameroon (17.1%, a difference of 0.11%).
DemographicsRating | RankChild Poverty Under the Age of 16
Immigrants | Lebanon
22.0
/100
|
#196
Fair
16.8%
Immigrants | Kenya
19.1
/100
|
#197
Poor
16.9%
Delaware
17.1
/100
|
#198
Poor
17.0%
Immigrants | Afghanistan
15.1
/100
|
#199
Poor
17.0%
Immigrants | Cameroon
14.7
/100
|
#200
Poor
17.1%
Immigrants | Uzbekistan
14.7
/100
|
#201
Poor
17.1%
Ugandans
14.3
/100
|
#202
Poor
17.1%
Immigrants | Sierra Leone
14.2
/100
|
#203
Poor
17.1%
Hmong
14.0
/100
|
#204
Poor
17.1%
Aleuts
13.9
/100
|
#205
Poor
17.1%
Alaska Natives
11.8
/100
|
#206
Poor
17.2%
German Russians
8.6
/100
|
#207
Tragic
17.4%
Pennsylvania Germans
7.5
/100
|
#208
Tragic
17.4%
Panamanians
6.9
/100
|
#209
Tragic
17.5%
Alaskan Athabascans
6.9
/100
|
#210
Tragic
17.5%