Pima vs Immigrants from Serbia Female Poverty Among 25-34 Year Olds

COMPARE

Pima
Race
Ancestry
AfghanAfricanAlaska NativeAlaskan AthabascanAlbanianAleutAlsatianAmericanApacheArabArapahoArgentineanArmenianAssyrian/Chaldean/SyriacAustralianAustrianBahamianBangladeshiBarbadianBasqueBelgianBelizeanBermudanBhutaneseBlackfeetBolivianBrazilianBritishBritish West IndianBulgarianBurmeseCajunCambodianCanadianCape VerdeanCarpatho RusynCelticCentral AmericanCentral American IndianCherokeeCheyenneChickasawChileanChineseChippewaChoctawColombianColvilleComancheCosta RicanCreeCreekCroatianCrowCubanCypriotCzechCzechoslovakianDanishDelawareDominicanDutchDutch West IndianEastern EuropeanEcuadorianEgyptianEnglishEstonianEthiopianEuropeanFijianFilipinoFinnishFrenchFrench American IndianFrench CanadianGermanGerman RussianGhanaianGreekGuamanian/ChamorroGuatemalanGuyaneseHaitianHmongHonduranHopiHoumaHungarianIcelanderIndian (Asian)IndonesianInupiatIranianIraqiIrishIroquoisIsraeliItalianJamaicanJapaneseJordanianKenyanKiowaKoreanLaotianLatvianLebaneseLiberianLithuanianLumbeeLuxembourgerMacedonianMalaysianMalteseMarshalleseMenomineeMexicanMexican American IndianMongolianMoroccanNative HawaiianNavajoNepaleseNew ZealanderNicaraguanNigerianNorthern EuropeanNorwegianOkinawanOsageOttawaPaiutePakistaniPalestinianPanamanianParaguayanPennsylvania GermanPeruvianPimaPolishPortuguesePotawatomiPuebloPuerto RicanPuget Sound SalishRomanianRussianSalvadoranSamoanScandinavianScotch-IrishScottishSeminoleSenegaleseSerbianShoshoneSierra LeoneanSiouxSlavicSlovakSloveneSomaliSouth AfricanSouth AmericanSouth American IndianSoviet UnionSpaniardSpanishSpanish AmericanSpanish American IndianSri LankanSubsaharan AfricanSudaneseSwedishSwissSyrianTaiwaneseThaiTlingit-HaidaTohono O'OdhamTonganTrinidadian and TobagonianTsimshianTurkishU.S. Virgin IslanderUgandanUkrainianUruguayanUteVenezuelanVietnameseWelshWest IndianYakamaYaquiYugoslavianYumanYup'ikZimbabwean
Immigration
NonimmigrantsImmigrantsAfghanistanAfricaAlbaniaArgentinaArmeniaAsiaAustraliaAustriaBahamasBangladeshBarbadosBelarusBelgiumBelizeBoliviaBosnia and HerzegovinaBrazilBulgariaBurma/MyanmarCabo VerdeCambodiaCameroonCanadaCaribbeanCentral AmericaChileChinaColombiaCongoCosta RicaCroatiaCubaCzechoslovakiaDenmarkDominicaDominican RepublicEastern AfricaEastern AsiaEastern EuropeEcuadorEgyptEl SalvadorEnglandEritreaEthiopiaEuropeFijiFranceGermanyGhanaGreeceGrenadaGuatemalaGuyanaHaitiHondurasHong KongHungaryIndiaIndonesiaIranIraqIrelandIsraelItalyJamaicaJapanJordanKazakhstanKenyaKoreaKuwaitLaosLatin AmericaLatviaLebanonLiberiaLithuaniaMalaysiaMexicoMicronesiaMiddle AfricaMoldovaMoroccoNepalNetherlandsNicaraguaNigeriaNorth AmericaNorth MacedoniaNorthern AfricaNorthern EuropeNorwayOceaniaPakistanPanamaPeruPhilippinesPolandPortugalRomaniaRussiaSaudi ArabiaScotlandSenegalSierra LeoneSingaporeSomaliaSouth AfricaSouth AmericaSouth Central AsiaSouth Eastern AsiaSouthern EuropeSpainSri LankaSt. Vincent and the GrenadinesSudanSwedenSwitzerlandSyriaTaiwanThailandTrinidad and TobagoTurkeyUgandaUkraineUruguayUzbekistanVenezuelaVietnamWest IndiesWestern AfricaWestern AsiaWestern EuropeYemenZaireZimbabweAzores
Immigrants from Serbia
Race
Ancestry
AfghanAfricanAlaska NativeAlaskan AthabascanAlbanianAleutAlsatianAmericanApacheArabArapahoArgentineanArmenianAssyrian/Chaldean/SyriacAustralianAustrianBahamianBangladeshiBarbadianBasqueBelgianBelizeanBermudanBhutaneseBlackfeetBolivianBrazilianBritishBritish West IndianBulgarianBurmeseCajunCambodianCanadianCape VerdeanCarpatho RusynCelticCentral AmericanCentral American IndianCherokeeCheyenneChickasawChileanChineseChippewaChoctawColombianColvilleComancheCosta RicanCreeCreekCroatianCrowCubanCypriotCzechCzechoslovakianDanishDelawareDominicanDutchDutch West IndianEastern EuropeanEcuadorianEgyptianEnglishEstonianEthiopianEuropeanFijianFilipinoFinnishFrenchFrench American IndianFrench CanadianGermanGerman RussianGhanaianGreekGuamanian/ChamorroGuatemalanGuyaneseHaitianHmongHonduranHopiHoumaHungarianIcelanderIndian (Asian)IndonesianInupiatIranianIraqiIrishIroquoisIsraeliItalianJamaicanJapaneseJordanianKenyanKiowaKoreanLaotianLatvianLebaneseLiberianLithuanianLumbeeLuxembourgerMacedonianMalaysianMalteseMarshalleseMenomineeMexicanMexican American IndianMongolianMoroccanNative HawaiianNavajoNepaleseNew ZealanderNicaraguanNigerianNorthern EuropeanNorwegianOkinawanOsageOttawaPaiutePakistaniPalestinianPanamanianParaguayanPennsylvania GermanPeruvianPolishPortuguesePotawatomiPuebloPuerto RicanPuget Sound SalishRomanianRussianSalvadoranSamoanScandinavianScotch-IrishScottishSeminoleSenegaleseSerbianShoshoneSierra LeoneanSiouxSlavicSlovakSloveneSomaliSouth AfricanSouth AmericanSouth American IndianSoviet UnionSpaniardSpanishSpanish AmericanSpanish American IndianSri LankanSubsaharan AfricanSudaneseSwedishSwissSyrianTaiwaneseThaiTlingit-HaidaTohono O'OdhamTonganTrinidadian and TobagonianTsimshianTurkishU.S. Virgin IslanderUgandanUkrainianUruguayanUteVenezuelanVietnameseWelshWest IndianYakamaYaquiYugoslavianYumanYup'ikZimbabwean
Immigration
NonimmigrantsImmigrantsAfghanistanAfricaAlbaniaArgentinaArmeniaAsiaAustraliaAustriaBahamasBangladeshBarbadosBelarusBelgiumBelizeBoliviaBosnia and HerzegovinaBrazilBulgariaBurma/MyanmarCabo VerdeCambodiaCameroonCanadaCaribbeanCentral AmericaChileChinaColombiaCongoCosta RicaCroatiaCubaCzechoslovakiaDenmarkDominicaDominican RepublicEastern AfricaEastern AsiaEastern EuropeEcuadorEgyptEl SalvadorEnglandEritreaEthiopiaEuropeFijiFranceGermanyGhanaGreeceGrenadaGuatemalaGuyanaHaitiHondurasHong KongHungaryIndiaIndonesiaIranIraqIrelandIsraelItalyJamaicaJapanJordanKazakhstanKenyaKoreaKuwaitLaosLatin AmericaLatviaLebanonLiberiaLithuaniaMalaysiaMexicoMicronesiaMiddle AfricaMoldovaMoroccoNepalNetherlandsNicaraguaNigeriaNorth AmericaNorth MacedoniaNorthern AfricaNorthern EuropeNorwayOceaniaPakistanPanamaPeruPhilippinesPolandPortugalRomaniaRussiaSaudi ArabiaScotlandSenegalSerbiaSierra LeoneSingaporeSomaliaSouth AfricaSouth AmericaSouth Central AsiaSouth Eastern AsiaSouthern EuropeSpainSri LankaSt. Vincent and the GrenadinesSudanSwedenSwitzerlandSyriaTaiwanThailandTrinidad and TobagoTurkeyUgandaUkraineUruguayUzbekistanVenezuelaVietnamWest IndiesWestern AfricaWestern AsiaWestern EuropeYemenZaireZimbabweAzores
Female Poverty Among 25-34 Year Olds
Income
Poverty
Unemployment
Labor Participation
Family Structure
Vehicle Availability
Education Level
Disability

Female Poverty Among 25-34 Year Olds Comparison

Pima

Immigrants from Serbia

Tragic
Exceptional
25.3%
FEMALE POVERTY AMONG 25-34 YEAR OLDS
0.0/ 100
METRIC RATING
345th/ 347
METRIC RANK
11.9%
FEMALE POVERTY AMONG 25-34 YEAR OLDS
99.7/ 100
METRIC RATING
46th/ 347
METRIC RANK

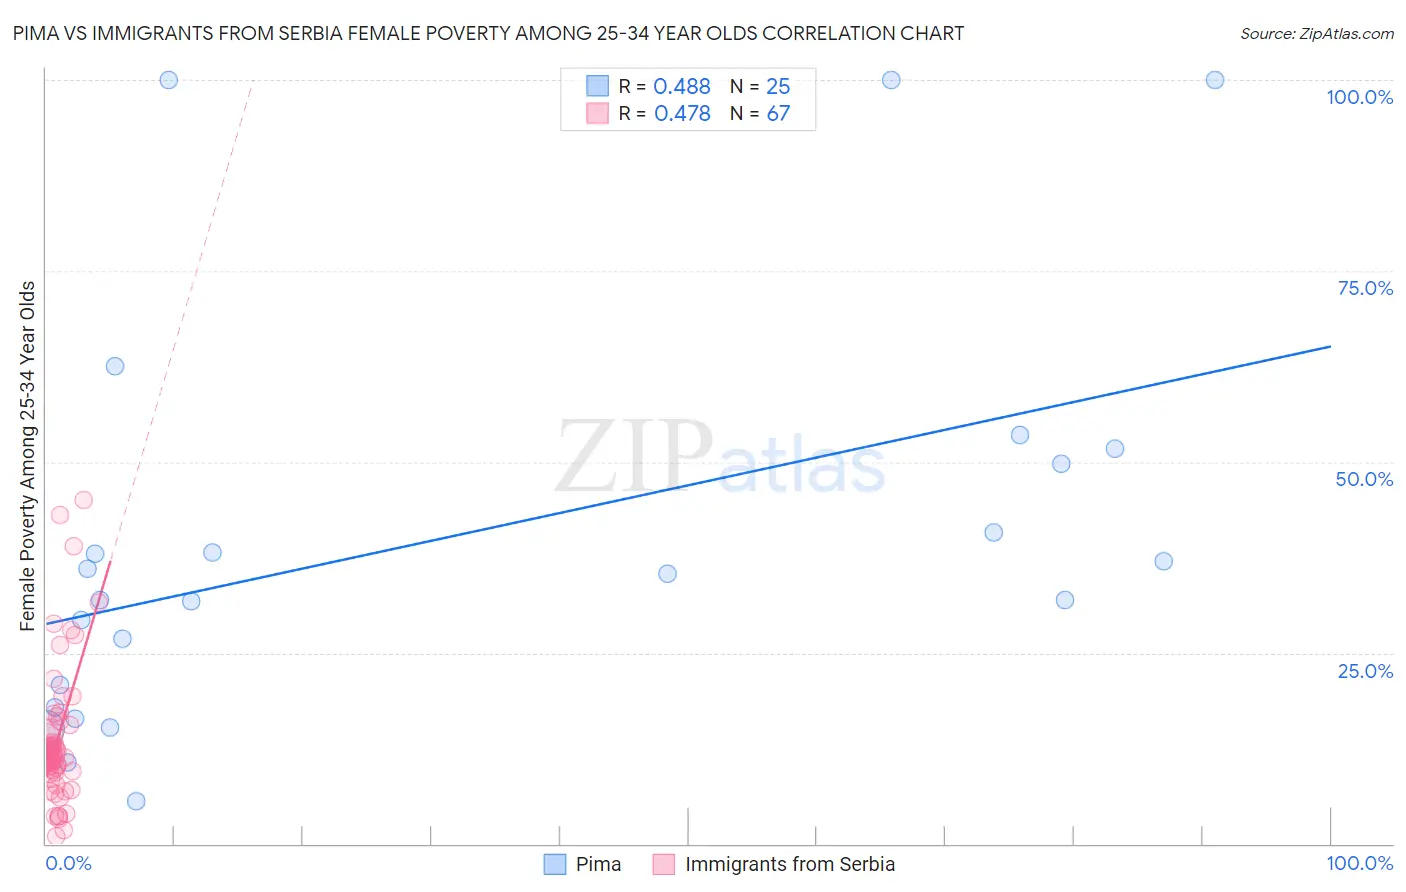
Pima vs Immigrants from Serbia Female Poverty Among 25-34 Year Olds Correlation Chart

The statistical analysis conducted on geographies consisting of 61,428,748 people shows a moderate positive correlation between the proportion of Pima and poverty level among females between the ages 25 and 34 in the United States with a correlation coefficient (R) of 0.488 and weighted average of 25.3%. Similarly, the statistical analysis conducted on geographies consisting of 130,855,081 people shows a moderate positive correlation between the proportion of Immigrants from Serbia and poverty level among females between the ages 25 and 34 in the United States with a correlation coefficient (R) of 0.478 and weighted average of 11.9%, a difference of 111.8%.
Pima vs Immigrants from Serbia Female Poverty Among 25-34 Year Olds

Female Poverty Among 25-34 Year Olds Correlation Summary

MeasurementPimaImmigrants from Serbia
Minimum5.6%0.98%
Maximum100.0%45.0%
Range94.4%44.0%
Mean39.8%13.5%
Median35.4%11.5%
Interquartile 25% (IQ1)19.3%9.4%
Interquartile 75% (IQ3)50.7%14.2%
Interquartile Range (IQR)31.3%4.7%
Standard Deviation (Sample)26.6%8.8%
Standard Deviation (Population)26.0%8.7%

Similar Demographics by Female Poverty Among 25-34 Year Olds

Demographics Similar to Pima by Female Poverty Among 25-34 Year Olds

In terms of female poverty among 25-34 year olds, the demographic groups most similar to Pima are Tohono O'odham (24.7%, a difference of 2.2%), Lumbee (26.3%, a difference of 3.9%), Puerto Rican (26.3%, a difference of 3.9%), Yup'ik (24.3%, a difference of 4.1%), and Hopi (23.7%, a difference of 6.8%).
DemographicsRating | RankFemale Poverty Among 25-34 Year Olds
Cajuns
0.0
/100
|
#333
Tragic
19.9%
Apache
0.0
/100
|
#334
Tragic
20.1%
Natives/Alaskans
0.0
/100
|
#335
Tragic
20.3%
Pueblo
0.0
/100
|
#336
Tragic
22.2%
Crow
0.0
/100
|
#337
Tragic
22.7%
Houma
0.0
/100
|
#338
Tragic
22.7%
Yuman
0.0
/100
|
#339
Tragic
22.9%
Sioux
0.0
/100
|
#340
Tragic
23.0%
Navajo
0.0
/100
|
#341
Tragic
23.3%
Hopi
0.0
/100
|
#342
Tragic
23.7%
Yup'ik
0.0
/100
|
#343
Tragic
24.3%
Tohono O'odham
0.0
/100
|
#344
Tragic
24.7%
Pima
0.0
/100
|
#345
Tragic
25.3%
Lumbee
0.0
/100
|
#346
Tragic
26.3%
Puerto Ricans
0.0
/100
|
#347
Tragic
26.3%

Demographics Similar to Immigrants from Serbia by Female Poverty Among 25-34 Year Olds

In terms of female poverty among 25-34 year olds, the demographic groups most similar to Immigrants from Serbia are Macedonian (11.9%, a difference of 0.010%), Korean (12.0%, a difference of 0.16%), Immigrants from Belarus (12.0%, a difference of 0.22%), Immigrants from Australia (11.9%, a difference of 0.27%), and Egyptian (11.9%, a difference of 0.29%).
DemographicsRating | RankFemale Poverty Among 25-34 Year Olds
Latvians
99.8
/100
|
#39
Exceptional
11.8%
Immigrants | Bulgaria
99.8
/100
|
#40
Exceptional
11.8%
Immigrants | Indonesia
99.8
/100
|
#41
Exceptional
11.8%
Immigrants | Turkey
99.7
/100
|
#42
Exceptional
11.9%
Egyptians
99.7
/100
|
#43
Exceptional
11.9%
Immigrants | Australia
99.7
/100
|
#44
Exceptional
11.9%
Macedonians
99.7
/100
|
#45
Exceptional
11.9%
Immigrants | Serbia
99.7
/100
|
#46
Exceptional
11.9%
Koreans
99.6
/100
|
#47
Exceptional
12.0%
Immigrants | Belarus
99.6
/100
|
#48
Exceptional
12.0%
Immigrants | Egypt
99.6
/100
|
#49
Exceptional
12.0%
Immigrants | Croatia
99.6
/100
|
#50
Exceptional
12.0%
Paraguayans
99.6
/100
|
#51
Exceptional
12.0%
Immigrants | Eastern Europe
99.6
/100
|
#52
Exceptional
12.0%
Immigrants | Israel
99.6
/100
|
#53
Exceptional
12.0%