Peruvian vs Immigrants from Iraq Seniors Poverty Over the Age of 75
COMPARE
Peruvian
Immigrants from Iraq
Seniors Poverty Over the Age of 75
Seniors Poverty Over the Age of 75 Comparison
Peruvians
Immigrants from Iraq
13.4%
SENIORS POVERTY OVER THE AGE OF 75
0.8/ 100
METRIC RATING
238th/ 347
METRIC RANK
11.5%
SENIORS POVERTY OVER THE AGE OF 75
94.9/ 100
METRIC RATING
84th/ 347
METRIC RANK
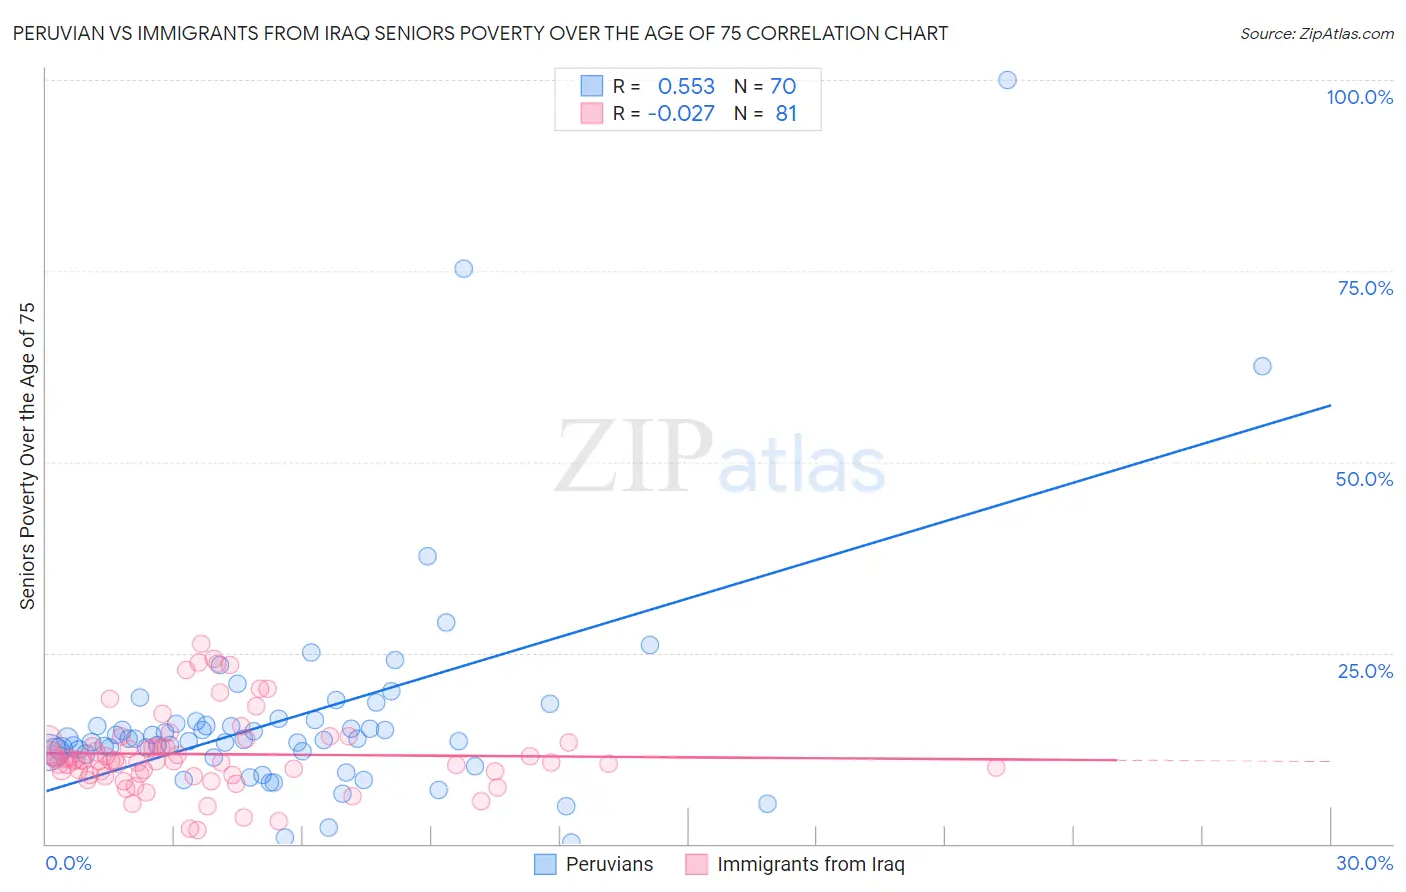
Peruvian vs Immigrants from Iraq Seniors Poverty Over the Age of 75 Correlation Chart
The statistical analysis conducted on geographies consisting of 359,440,358 people shows a substantial positive correlation between the proportion of Peruvians and poverty level among seniors over the age of 75 in the United States with a correlation coefficient (R) of 0.553 and weighted average of 13.4%. Similarly, the statistical analysis conducted on geographies consisting of 194,011,425 people shows no correlation between the proportion of Immigrants from Iraq and poverty level among seniors over the age of 75 in the United States with a correlation coefficient (R) of -0.027 and weighted average of 11.5%, a difference of 16.6%.
Seniors Poverty Over the Age of 75 Correlation Summary
| Measurement | Peruvian | Immigrants from Iraq |
| Minimum | 0.17% | 1.8% |
| Maximum | 100.0% | 26.2% |
| Range | 99.8% | 24.4% |
| Mean | 16.7% | 11.7% |
| Median | 13.7% | 10.9% |
| Interquartile 25% (IQ1) | 11.9% | 9.1% |
| Interquartile 75% (IQ3) | 16.0% | 13.0% |
| Interquartile Range (IQR) | 4.1% | 4.0% |
| Standard Deviation (Sample) | 15.0% | 5.0% |
| Standard Deviation (Population) | 14.9% | 5.0% |
Similar Demographics by Seniors Poverty Over the Age of 75
Demographics Similar to Peruvians by Seniors Poverty Over the Age of 75
In terms of seniors poverty over the age of 75, the demographic groups most similar to Peruvians are Alaskan Athabascan (13.4%, a difference of 0.020%), Panamanian (13.4%, a difference of 0.10%), Moroccan (13.3%, a difference of 0.20%), Japanese (13.3%, a difference of 0.21%), and Argentinean (13.4%, a difference of 0.41%).
| Demographics | Rating | Rank | Seniors Poverty Over the Age of 75 |
| Sub-Saharan Africans | 1.5 /100 | #231 | Tragic 13.2% |
| Immigrants | Chile | 1.3 /100 | #232 | Tragic 13.3% |
| Immigrants | Costa Rica | 1.3 /100 | #233 | Tragic 13.3% |
| Immigrants | Israel | 1.1 /100 | #234 | Tragic 13.3% |
| Japanese | 0.9 /100 | #235 | Tragic 13.3% |
| Moroccans | 0.9 /100 | #236 | Tragic 13.3% |
| Alaskan Athabascans | 0.8 /100 | #237 | Tragic 13.4% |
| Peruvians | 0.8 /100 | #238 | Tragic 13.4% |
| Panamanians | 0.8 /100 | #239 | Tragic 13.4% |
| Argentineans | 0.7 /100 | #240 | Tragic 13.4% |
| Immigrants | Russia | 0.6 /100 | #241 | Tragic 13.4% |
| Immigrants | Somalia | 0.6 /100 | #242 | Tragic 13.5% |
| Dutch West Indians | 0.6 /100 | #243 | Tragic 13.5% |
| Spanish Americans | 0.5 /100 | #244 | Tragic 13.5% |
| Uruguayans | 0.5 /100 | #245 | Tragic 13.5% |
Demographics Similar to Immigrants from Iraq by Seniors Poverty Over the Age of 75
In terms of seniors poverty over the age of 75, the demographic groups most similar to Immigrants from Iraq are Immigrants from South Africa (11.5%, a difference of 0.0%), Iranian (11.5%, a difference of 0.090%), Basque (11.5%, a difference of 0.10%), Immigrants from Bulgaria (11.5%, a difference of 0.10%), and Australian (11.5%, a difference of 0.12%).
| Demographics | Rating | Rank | Seniors Poverty Over the Age of 75 |
| Whites/Caucasians | 95.5 /100 | #77 | Exceptional 11.4% |
| Macedonians | 95.5 /100 | #78 | Exceptional 11.4% |
| Filipinos | 95.5 /100 | #79 | Exceptional 11.4% |
| Alaska Natives | 95.4 /100 | #80 | Exceptional 11.4% |
| Basques | 95.1 /100 | #81 | Exceptional 11.5% |
| Iranians | 95.1 /100 | #82 | Exceptional 11.5% |
| Immigrants | South Africa | 94.9 /100 | #83 | Exceptional 11.5% |
| Immigrants | Iraq | 94.9 /100 | #84 | Exceptional 11.5% |
| Immigrants | Bulgaria | 94.7 /100 | #85 | Exceptional 11.5% |
| Australians | 94.6 /100 | #86 | Exceptional 11.5% |
| Koreans | 94.5 /100 | #87 | Exceptional 11.5% |
| Immigrants | Croatia | 94.5 /100 | #88 | Exceptional 11.5% |
| Immigrants | Sri Lanka | 94.4 /100 | #89 | Exceptional 11.5% |
| Aleuts | 94.1 /100 | #90 | Exceptional 11.5% |
| Immigrants | Germany | 94.1 /100 | #91 | Exceptional 11.5% |