Peruvian vs British West Indian Single Male Poverty
COMPARE
Peruvian
British West Indian
Single Male Poverty
Single Male Poverty Comparison
Peruvians
British West Indians
11.8%
SINGLE MALE POVERTY
99.8/ 100
METRIC RATING
60th/ 347
METRIC RANK
13.4%
SINGLE MALE POVERTY
3.4/ 100
METRIC RATING
237th/ 347
METRIC RANK
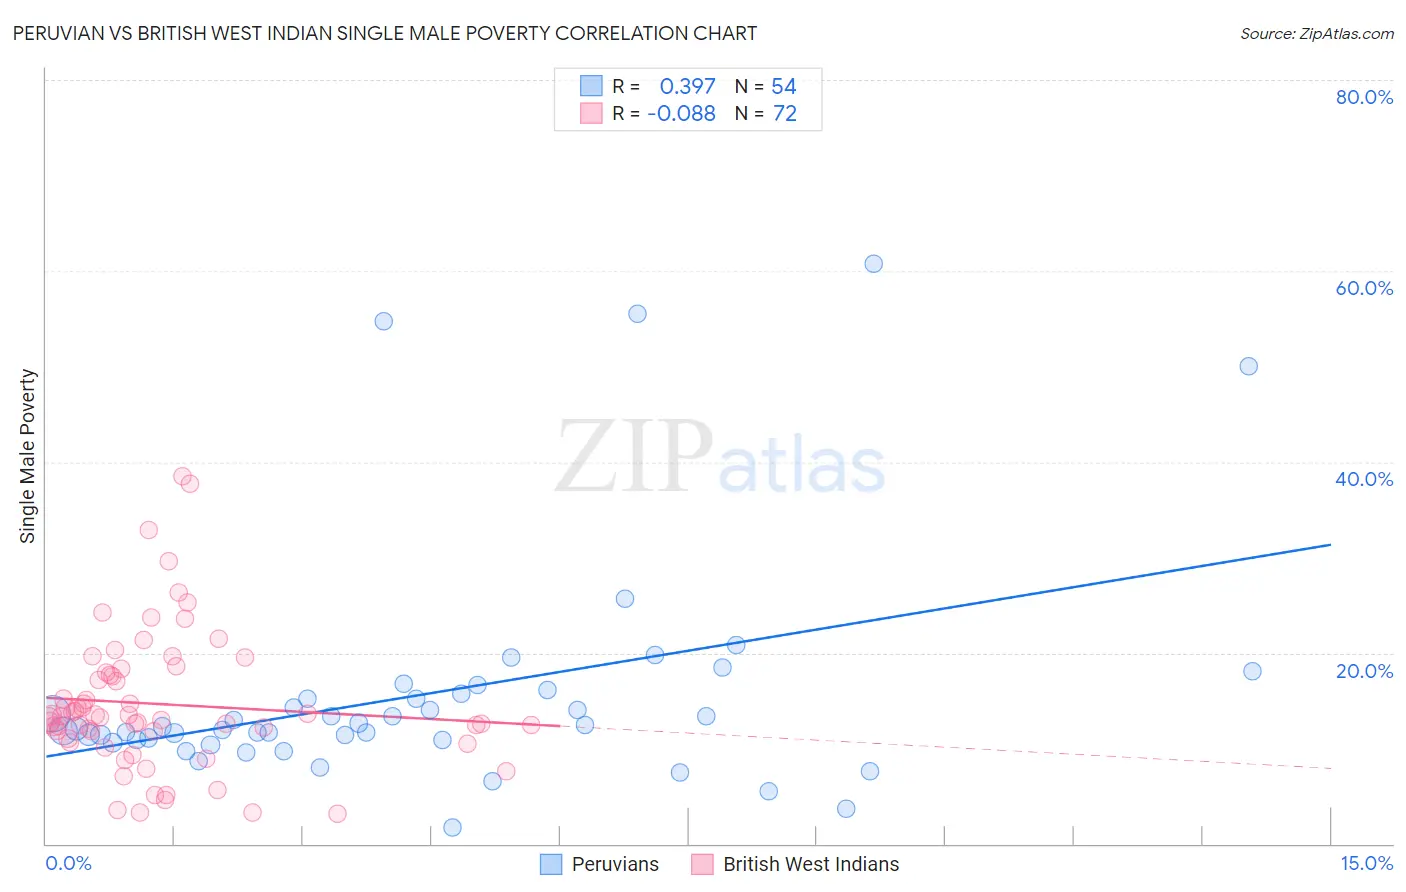
Peruvian vs British West Indian Single Male Poverty Correlation Chart
The statistical analysis conducted on geographies consisting of 326,481,306 people shows a mild positive correlation between the proportion of Peruvians and poverty level among single males in the United States with a correlation coefficient (R) of 0.397 and weighted average of 11.8%. Similarly, the statistical analysis conducted on geographies consisting of 145,852,012 people shows a slight negative correlation between the proportion of British West Indians and poverty level among single males in the United States with a correlation coefficient (R) of -0.088 and weighted average of 13.4%, a difference of 13.4%.
Single Male Poverty Correlation Summary
| Measurement | Peruvian | British West Indian |
| Minimum | 1.7% | 3.1% |
| Maximum | 60.7% | 38.5% |
| Range | 59.0% | 35.3% |
| Mean | 15.6% | 14.6% |
| Median | 12.1% | 13.3% |
| Interquartile 25% (IQ1) | 10.9% | 11.3% |
| Interquartile 75% (IQ3) | 15.7% | 17.8% |
| Interquartile Range (IQR) | 4.8% | 6.4% |
| Standard Deviation (Sample) | 12.1% | 7.2% |
| Standard Deviation (Population) | 12.0% | 7.2% |
Similar Demographics by Single Male Poverty
Demographics Similar to Peruvians by Single Male Poverty
In terms of single male poverty, the demographic groups most similar to Peruvians are Cambodian (11.8%, a difference of 0.020%), Brazilian (11.8%, a difference of 0.21%), Immigrants from Brazil (11.7%, a difference of 0.29%), Immigrants from Romania (11.7%, a difference of 0.32%), and Immigrants from Sri Lanka (11.8%, a difference of 0.40%).
| Demographics | Rating | Rank | Single Male Poverty |
| Bulgarians | 99.9 /100 | #53 | Exceptional 11.7% |
| Immigrants | Uzbekistan | 99.9 /100 | #54 | Exceptional 11.7% |
| Cypriots | 99.9 /100 | #55 | Exceptional 11.7% |
| Burmese | 99.8 /100 | #56 | Exceptional 11.7% |
| Immigrants | Romania | 99.8 /100 | #57 | Exceptional 11.7% |
| Immigrants | Brazil | 99.8 /100 | #58 | Exceptional 11.7% |
| Brazilians | 99.8 /100 | #59 | Exceptional 11.8% |
| Peruvians | 99.8 /100 | #60 | Exceptional 11.8% |
| Cambodians | 99.8 /100 | #61 | Exceptional 11.8% |
| Immigrants | Sri Lanka | 99.7 /100 | #62 | Exceptional 11.8% |
| Immigrants | Belarus | 99.7 /100 | #63 | Exceptional 11.8% |
| Immigrants | Eastern Europe | 99.6 /100 | #64 | Exceptional 11.8% |
| Laotians | 99.6 /100 | #65 | Exceptional 11.9% |
| Immigrants | Uruguay | 99.6 /100 | #66 | Exceptional 11.9% |
| Immigrants | Ukraine | 99.6 /100 | #67 | Exceptional 11.9% |
Demographics Similar to British West Indians by Single Male Poverty
In terms of single male poverty, the demographic groups most similar to British West Indians are Luxembourger (13.4%, a difference of 0.060%), Immigrants from Ghana (13.4%, a difference of 0.10%), Bangladeshi (13.3%, a difference of 0.11%), Czechoslovakian (13.4%, a difference of 0.18%), and British (13.3%, a difference of 0.21%).
| Demographics | Rating | Rank | Single Male Poverty |
| Ghanaians | 6.1 /100 | #230 | Tragic 13.3% |
| Slavs | 5.3 /100 | #231 | Tragic 13.3% |
| Immigrants | Caribbean | 5.0 /100 | #232 | Tragic 13.3% |
| British | 4.0 /100 | #233 | Tragic 13.3% |
| Canadians | 4.0 /100 | #234 | Tragic 13.3% |
| Bangladeshis | 3.7 /100 | #235 | Tragic 13.3% |
| Luxembourgers | 3.6 /100 | #236 | Tragic 13.4% |
| British West Indians | 3.4 /100 | #237 | Tragic 13.4% |
| Immigrants | Ghana | 3.2 /100 | #238 | Tragic 13.4% |
| Czechoslovakians | 3.0 /100 | #239 | Tragic 13.4% |
| Belizeans | 2.3 /100 | #240 | Tragic 13.4% |
| Immigrants | Germany | 2.1 /100 | #241 | Tragic 13.4% |
| Carpatho Rusyns | 2.1 /100 | #242 | Tragic 13.4% |
| Barbadians | 2.1 /100 | #243 | Tragic 13.4% |
| Immigrants | Senegal | 1.7 /100 | #244 | Tragic 13.5% |