Pennsylvania German vs Israeli Poverty
COMPARE
Pennsylvania German
Israeli
Poverty
Poverty Comparison
Pennsylvania Germans
Israelis
12.2%
POVERTY
60.8/ 100
METRIC RATING
159th/ 347
METRIC RANK
12.5%
POVERTY
36.4/ 100
METRIC RATING
185th/ 347
METRIC RANK
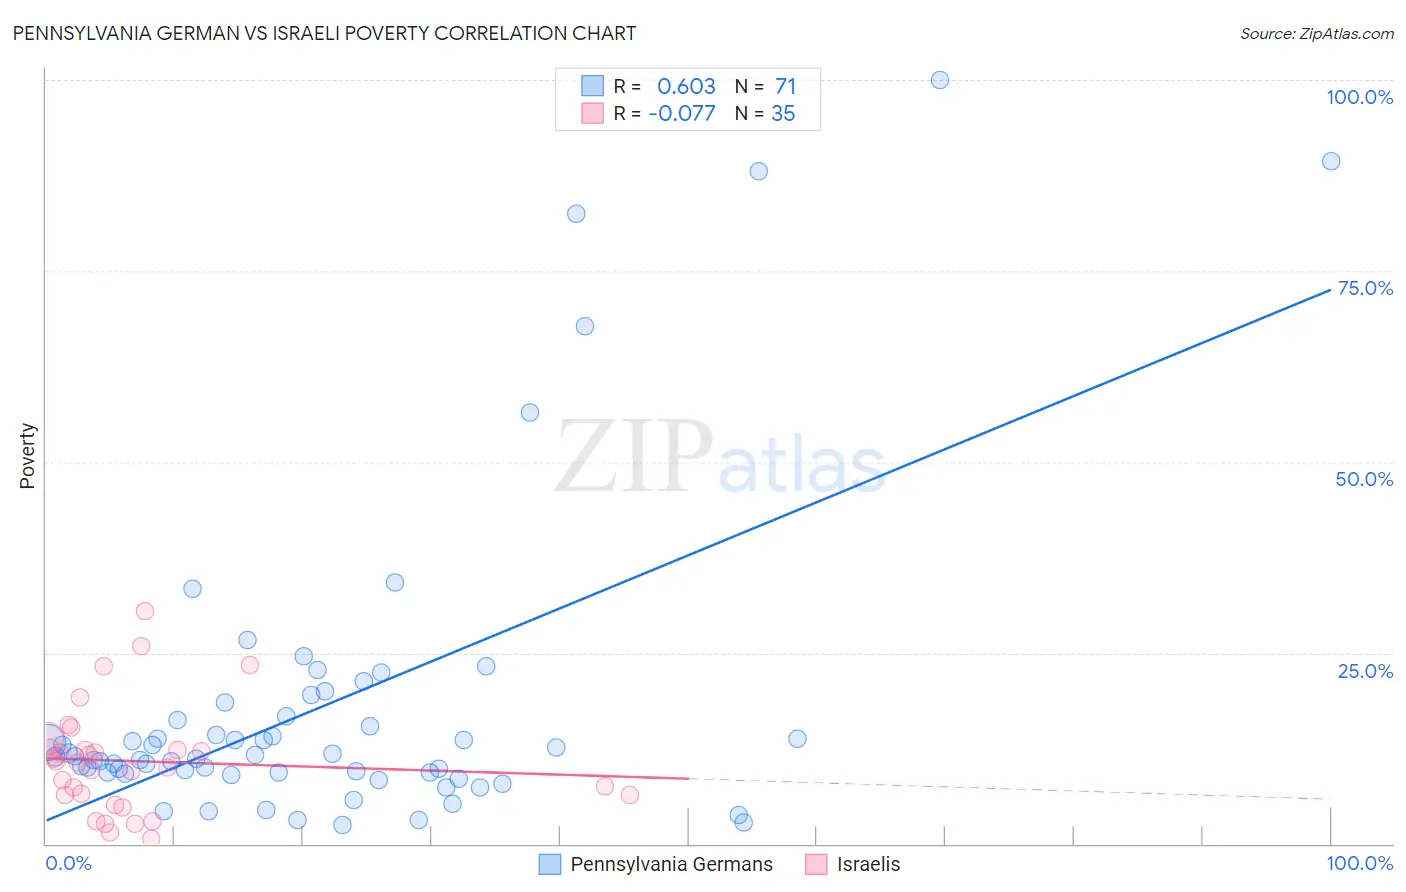
Pennsylvania German vs Israeli Poverty Correlation Chart
The statistical analysis conducted on geographies consisting of 234,033,089 people shows a significant positive correlation between the proportion of Pennsylvania Germans and poverty level in the United States with a correlation coefficient (R) of 0.603 and weighted average of 12.2%. Similarly, the statistical analysis conducted on geographies consisting of 211,053,584 people shows a slight negative correlation between the proportion of Israelis and poverty level in the United States with a correlation coefficient (R) of -0.077 and weighted average of 12.5%, a difference of 2.4%.
Poverty Correlation Summary
| Measurement | Pennsylvania German | Israeli |
| Minimum | 2.4% | 0.63% |
| Maximum | 100.0% | 30.5% |
| Range | 97.6% | 29.8% |
| Mean | 18.1% | 10.8% |
| Median | 11.4% | 10.7% |
| Interquartile 25% (IQ1) | 9.3% | 6.3% |
| Interquartile 75% (IQ3) | 16.7% | 12.4% |
| Interquartile Range (IQR) | 7.5% | 6.0% |
| Standard Deviation (Sample) | 20.6% | 7.0% |
| Standard Deviation (Population) | 20.5% | 6.9% |
Similar Demographics by Poverty
Demographics Similar to Pennsylvania Germans by Poverty
In terms of poverty, the demographic groups most similar to Pennsylvania Germans are Immigrants from Nepal (12.2%, a difference of 0.050%), Taiwanese (12.2%, a difference of 0.10%), Costa Rican (12.2%, a difference of 0.14%), Scotch-Irish (12.2%, a difference of 0.18%), and Immigrants from Fiji (12.2%, a difference of 0.18%).
| Demographics | Rating | Rank | Poverty |
| Armenians | 67.6 /100 | #152 | Good 12.1% |
| Immigrants | Northern Africa | 63.9 /100 | #153 | Good 12.1% |
| Guamanians/Chamorros | 63.9 /100 | #154 | Good 12.1% |
| Hungarians | 63.6 /100 | #155 | Good 12.2% |
| Scotch-Irish | 62.6 /100 | #156 | Good 12.2% |
| Costa Ricans | 62.2 /100 | #157 | Good 12.2% |
| Taiwanese | 61.8 /100 | #158 | Good 12.2% |
| Pennsylvania Germans | 60.8 /100 | #159 | Good 12.2% |
| Immigrants | Nepal | 60.4 /100 | #160 | Good 12.2% |
| Immigrants | Fiji | 59.1 /100 | #161 | Average 12.2% |
| Ethiopians | 59.1 /100 | #162 | Average 12.2% |
| Immigrants | Ethiopia | 58.6 /100 | #163 | Average 12.2% |
| Colombians | 57.8 /100 | #164 | Average 12.2% |
| Immigrants | Albania | 57.7 /100 | #165 | Average 12.2% |
| Venezuelans | 56.9 /100 | #166 | Average 12.2% |
Demographics Similar to Israelis by Poverty
In terms of poverty, the demographic groups most similar to Israelis are Immigrants from Sierra Leone (12.5%, a difference of 0.020%), Kenyan (12.5%, a difference of 0.24%), Hawaiian (12.5%, a difference of 0.25%), Immigrants from Costa Rica (12.5%, a difference of 0.34%), and Aleut (12.5%, a difference of 0.34%).
| Demographics | Rating | Rank | Poverty |
| Uruguayans | 44.7 /100 | #178 | Average 12.4% |
| Immigrants | Morocco | 44.0 /100 | #179 | Average 12.4% |
| Mongolians | 43.6 /100 | #180 | Average 12.4% |
| Immigrants | Afghanistan | 42.1 /100 | #181 | Average 12.4% |
| Immigrants | Cameroon | 41.7 /100 | #182 | Average 12.4% |
| Immigrants | Iraq | 40.2 /100 | #183 | Average 12.4% |
| Kenyans | 38.8 /100 | #184 | Fair 12.5% |
| Israelis | 36.4 /100 | #185 | Fair 12.5% |
| Immigrants | Sierra Leone | 36.3 /100 | #186 | Fair 12.5% |
| Hawaiians | 34.1 /100 | #187 | Fair 12.5% |
| Immigrants | Costa Rica | 33.3 /100 | #188 | Fair 12.5% |
| Aleuts | 33.2 /100 | #189 | Fair 12.5% |
| Immigrants | South America | 32.3 /100 | #190 | Fair 12.5% |
| Sierra Leoneans | 31.5 /100 | #191 | Fair 12.6% |
| South American Indians | 23.3 /100 | #192 | Fair 12.7% |