Pennsylvania German vs Immigrants from Western Asia Male Poverty
COMPARE
Pennsylvania German
Immigrants from Western Asia
Male Poverty
Male Poverty Comparison
Pennsylvania Germans
Immigrants from Western Asia
11.2%
MALE POVERTY
50.5/ 100
METRIC RATING
173rd/ 347
METRIC RANK
11.8%
MALE POVERTY
9.8/ 100
METRIC RATING
203rd/ 347
METRIC RANK
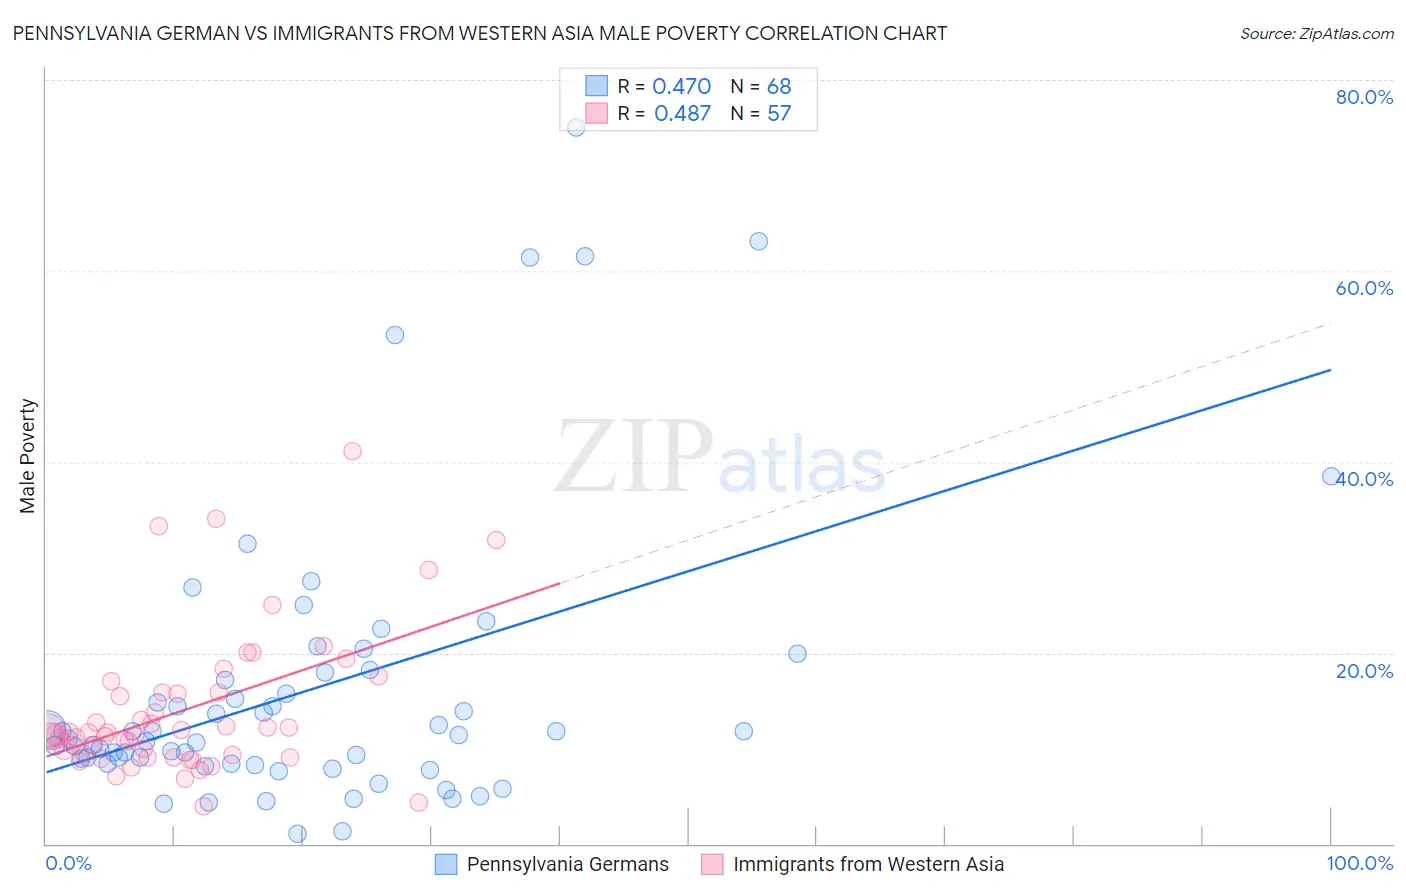
Pennsylvania German vs Immigrants from Western Asia Male Poverty Correlation Chart
The statistical analysis conducted on geographies consisting of 233,970,359 people shows a moderate positive correlation between the proportion of Pennsylvania Germans and poverty level among males in the United States with a correlation coefficient (R) of 0.470 and weighted average of 11.2%. Similarly, the statistical analysis conducted on geographies consisting of 404,054,336 people shows a moderate positive correlation between the proportion of Immigrants from Western Asia and poverty level among males in the United States with a correlation coefficient (R) of 0.487 and weighted average of 11.8%, a difference of 5.5%.
Male Poverty Correlation Summary
| Measurement | Pennsylvania German | Immigrants from Western Asia |
| Minimum | 1.1% | 4.0% |
| Maximum | 75.0% | 41.1% |
| Range | 73.9% | 37.1% |
| Mean | 16.1% | 13.9% |
| Median | 11.2% | 11.7% |
| Interquartile 25% (IQ1) | 8.3% | 9.2% |
| Interquartile 75% (IQ3) | 17.5% | 15.9% |
| Interquartile Range (IQR) | 9.2% | 6.7% |
| Standard Deviation (Sample) | 15.1% | 7.5% |
| Standard Deviation (Population) | 15.0% | 7.4% |
Similar Demographics by Male Poverty
Demographics Similar to Pennsylvania Germans by Male Poverty
In terms of male poverty, the demographic groups most similar to Pennsylvania Germans are Immigrants from Ethiopia (11.2%, a difference of 0.020%), Immigrants from Oceania (11.2%, a difference of 0.040%), Uruguayan (11.2%, a difference of 0.060%), Celtic (11.2%, a difference of 0.29%), and South American (11.1%, a difference of 0.32%).
| Demographics | Rating | Rank | Male Poverty |
| Immigrants | Albania | 55.3 /100 | #166 | Average 11.1% |
| Hungarians | 55.1 /100 | #167 | Average 11.1% |
| Immigrants | Portugal | 54.9 /100 | #168 | Average 11.1% |
| Immigrants | Colombia | 54.2 /100 | #169 | Average 11.1% |
| South Americans | 53.8 /100 | #170 | Average 11.1% |
| Uruguayans | 51.0 /100 | #171 | Average 11.2% |
| Immigrants | Ethiopia | 50.7 /100 | #172 | Average 11.2% |
| Pennsylvania Germans | 50.5 /100 | #173 | Average 11.2% |
| Immigrants | Oceania | 50.0 /100 | #174 | Average 11.2% |
| Celtics | 47.5 /100 | #175 | Average 11.2% |
| Immigrants | Fiji | 46.0 /100 | #176 | Average 11.2% |
| Lebanese | 45.6 /100 | #177 | Average 11.2% |
| Immigrants | Cameroon | 44.5 /100 | #178 | Average 11.2% |
| Immigrants | Syria | 40.3 /100 | #179 | Average 11.3% |
| Immigrants | Morocco | 40.1 /100 | #180 | Average 11.3% |
Demographics Similar to Immigrants from Western Asia by Male Poverty
In terms of male poverty, the demographic groups most similar to Immigrants from Western Asia are Aleut (11.8%, a difference of 0.14%), Immigrants from Uganda (11.8%, a difference of 0.36%), Spaniard (11.7%, a difference of 0.86%), Immigrants from Lebanon (11.7%, a difference of 0.87%), and Spanish (11.7%, a difference of 0.97%).
| Demographics | Rating | Rank | Male Poverty |
| Hmong | 15.8 /100 | #196 | Poor 11.6% |
| Delaware | 15.4 /100 | #197 | Poor 11.7% |
| Iraqis | 14.7 /100 | #198 | Poor 11.7% |
| Spanish | 14.1 /100 | #199 | Poor 11.7% |
| Immigrants | Lebanon | 13.6 /100 | #200 | Poor 11.7% |
| Spaniards | 13.5 /100 | #201 | Poor 11.7% |
| Aleuts | 10.4 /100 | #202 | Poor 11.8% |
| Immigrants | Western Asia | 9.8 /100 | #203 | Tragic 11.8% |
| Immigrants | Uganda | 8.5 /100 | #204 | Tragic 11.8% |
| Panamanians | 6.2 /100 | #205 | Tragic 11.9% |
| Immigrants | Eastern Africa | 5.4 /100 | #206 | Tragic 12.0% |
| Malaysians | 5.2 /100 | #207 | Tragic 12.0% |
| Immigrants | Immigrants | 4.5 /100 | #208 | Tragic 12.0% |
| Immigrants | Azores | 4.3 /100 | #209 | Tragic 12.0% |
| Moroccans | 4.2 /100 | #210 | Tragic 12.0% |