Pennsylvania German vs Argentinean Family Poverty
COMPARE
Pennsylvania German
Argentinean
Family Poverty
Family Poverty Comparison
Pennsylvania Germans
Argentineans
8.8%
FAMILY POVERTY
66.0/ 100
METRIC RATING
163rd/ 347
METRIC RANK
8.4%
FAMILY POVERTY
89.6/ 100
METRIC RATING
128th/ 347
METRIC RANK
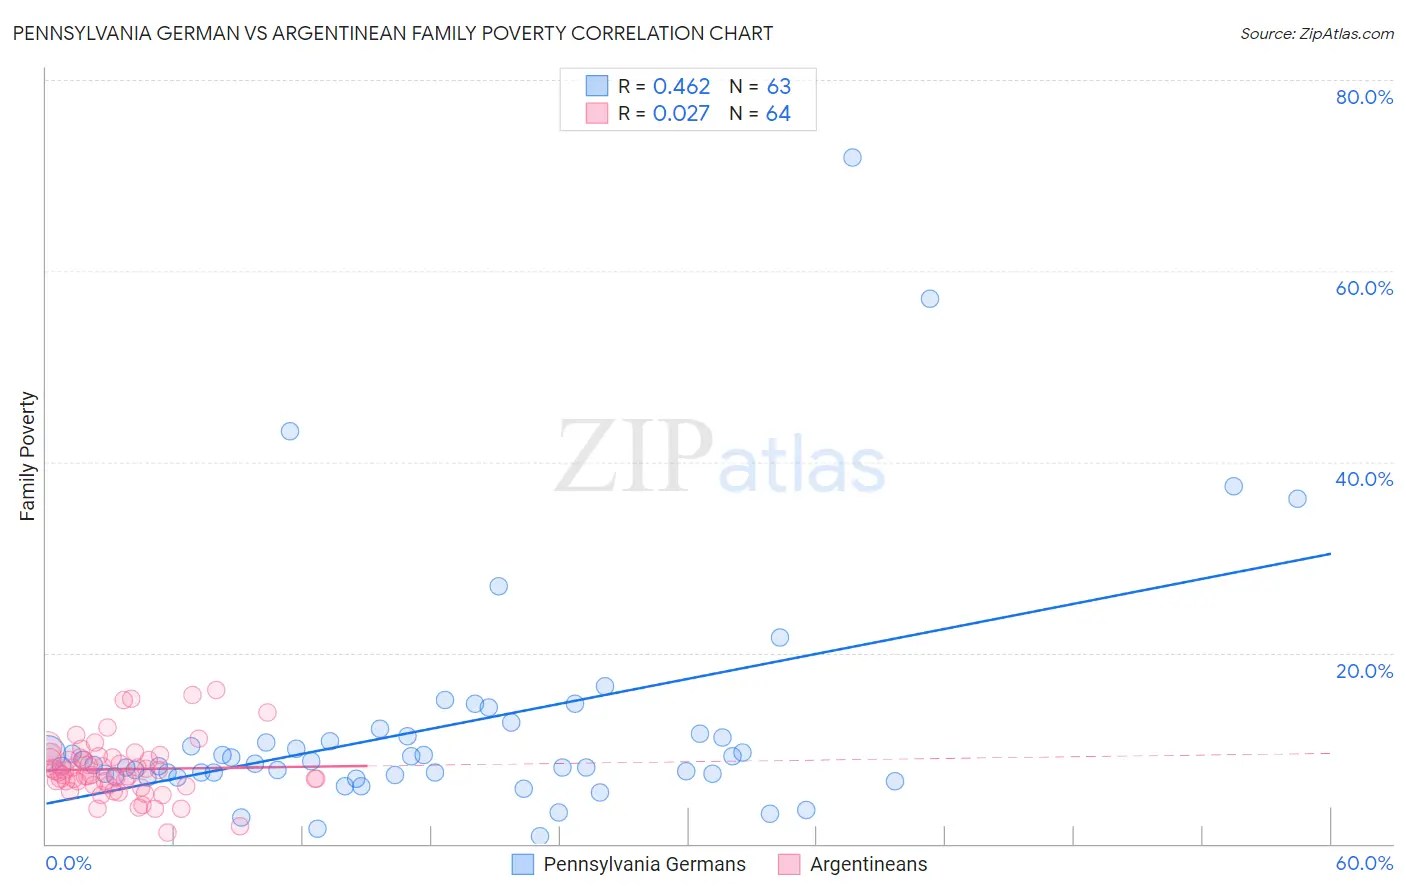
Pennsylvania German vs Argentinean Family Poverty Correlation Chart
The statistical analysis conducted on geographies consisting of 233,657,746 people shows a moderate positive correlation between the proportion of Pennsylvania Germans and poverty level among families in the United States with a correlation coefficient (R) of 0.462 and weighted average of 8.8%. Similarly, the statistical analysis conducted on geographies consisting of 296,579,714 people shows no correlation between the proportion of Argentineans and poverty level among families in the United States with a correlation coefficient (R) of 0.027 and weighted average of 8.4%, a difference of 5.2%.
Family Poverty Correlation Summary
| Measurement | Pennsylvania German | Argentinean |
| Minimum | 0.74% | 1.2% |
| Maximum | 71.9% | 16.2% |
| Range | 71.1% | 14.9% |
| Mean | 12.1% | 7.8% |
| Median | 8.4% | 7.4% |
| Interquartile 25% (IQ1) | 7.2% | 6.2% |
| Interquartile 75% (IQ3) | 11.3% | 9.0% |
| Interquartile Range (IQR) | 4.1% | 2.9% |
| Standard Deviation (Sample) | 12.3% | 3.0% |
| Standard Deviation (Population) | 12.2% | 3.0% |
Similar Demographics by Family Poverty
Demographics Similar to Pennsylvania Germans by Family Poverty
In terms of family poverty, the demographic groups most similar to Pennsylvania Germans are Ethiopian (8.8%, a difference of 0.050%), Immigrants from Northern Africa (8.8%, a difference of 0.14%), Celtic (8.8%, a difference of 0.16%), Hungarian (8.8%, a difference of 0.18%), and Guamanian/Chamorro (8.8%, a difference of 0.19%).
| Demographics | Rating | Rank | Family Poverty |
| Immigrants | Oceania | 71.2 /100 | #156 | Good 8.7% |
| Tsimshian | 69.3 /100 | #157 | Good 8.8% |
| Whites/Caucasians | 69.1 /100 | #158 | Good 8.8% |
| Peruvians | 68.0 /100 | #159 | Good 8.8% |
| Hungarians | 67.2 /100 | #160 | Good 8.8% |
| Immigrants | Northern Africa | 66.9 /100 | #161 | Good 8.8% |
| Ethiopians | 66.3 /100 | #162 | Good 8.8% |
| Pennsylvania Germans | 66.0 /100 | #163 | Good 8.8% |
| Celtics | 64.9 /100 | #164 | Good 8.8% |
| Guamanians/Chamorros | 64.7 /100 | #165 | Good 8.8% |
| Afghans | 63.5 /100 | #166 | Good 8.8% |
| Immigrants | Ethiopia | 62.5 /100 | #167 | Good 8.9% |
| Israelis | 62.1 /100 | #168 | Good 8.9% |
| Immigrants | Chile | 59.6 /100 | #169 | Average 8.9% |
| Kenyans | 58.2 /100 | #170 | Average 8.9% |
Demographics Similar to Argentineans by Family Poverty
In terms of family poverty, the demographic groups most similar to Argentineans are Immigrants from Hungary (8.4%, a difference of 0.14%), Portuguese (8.4%, a difference of 0.15%), Icelander (8.3%, a difference of 0.27%), Immigrants from Bosnia and Herzegovina (8.4%, a difference of 0.34%), and Puget Sound Salish (8.4%, a difference of 0.35%).
| Demographics | Rating | Rank | Family Poverty |
| Native Hawaiians | 91.3 /100 | #121 | Exceptional 8.3% |
| Paraguayans | 91.2 /100 | #122 | Exceptional 8.3% |
| Palestinians | 91.1 /100 | #123 | Exceptional 8.3% |
| Soviet Union | 90.8 /100 | #124 | Exceptional 8.3% |
| Pakistanis | 90.8 /100 | #125 | Exceptional 8.3% |
| Icelanders | 90.3 /100 | #126 | Exceptional 8.3% |
| Immigrants | Hungary | 89.9 /100 | #127 | Excellent 8.4% |
| Argentineans | 89.6 /100 | #128 | Excellent 8.4% |
| Portuguese | 89.2 /100 | #129 | Excellent 8.4% |
| Immigrants | Bosnia and Herzegovina | 88.6 /100 | #130 | Excellent 8.4% |
| Puget Sound Salish | 88.6 /100 | #131 | Excellent 8.4% |
| Immigrants | Argentina | 88.2 /100 | #132 | Excellent 8.4% |
| Sri Lankans | 86.6 /100 | #133 | Excellent 8.5% |
| Chileans | 86.6 /100 | #134 | Excellent 8.5% |
| Immigrants | Malaysia | 86.5 /100 | #135 | Excellent 8.5% |