Paraguayan vs Korean Male Poverty
COMPARE
Paraguayan
Korean
Male Poverty
Male Poverty Comparison
Paraguayans
Koreans
10.2%
MALE POVERTY
97.1/ 100
METRIC RATING
70th/ 347
METRIC RANK
9.9%
MALE POVERTY
99.2/ 100
METRIC RATING
41st/ 347
METRIC RANK
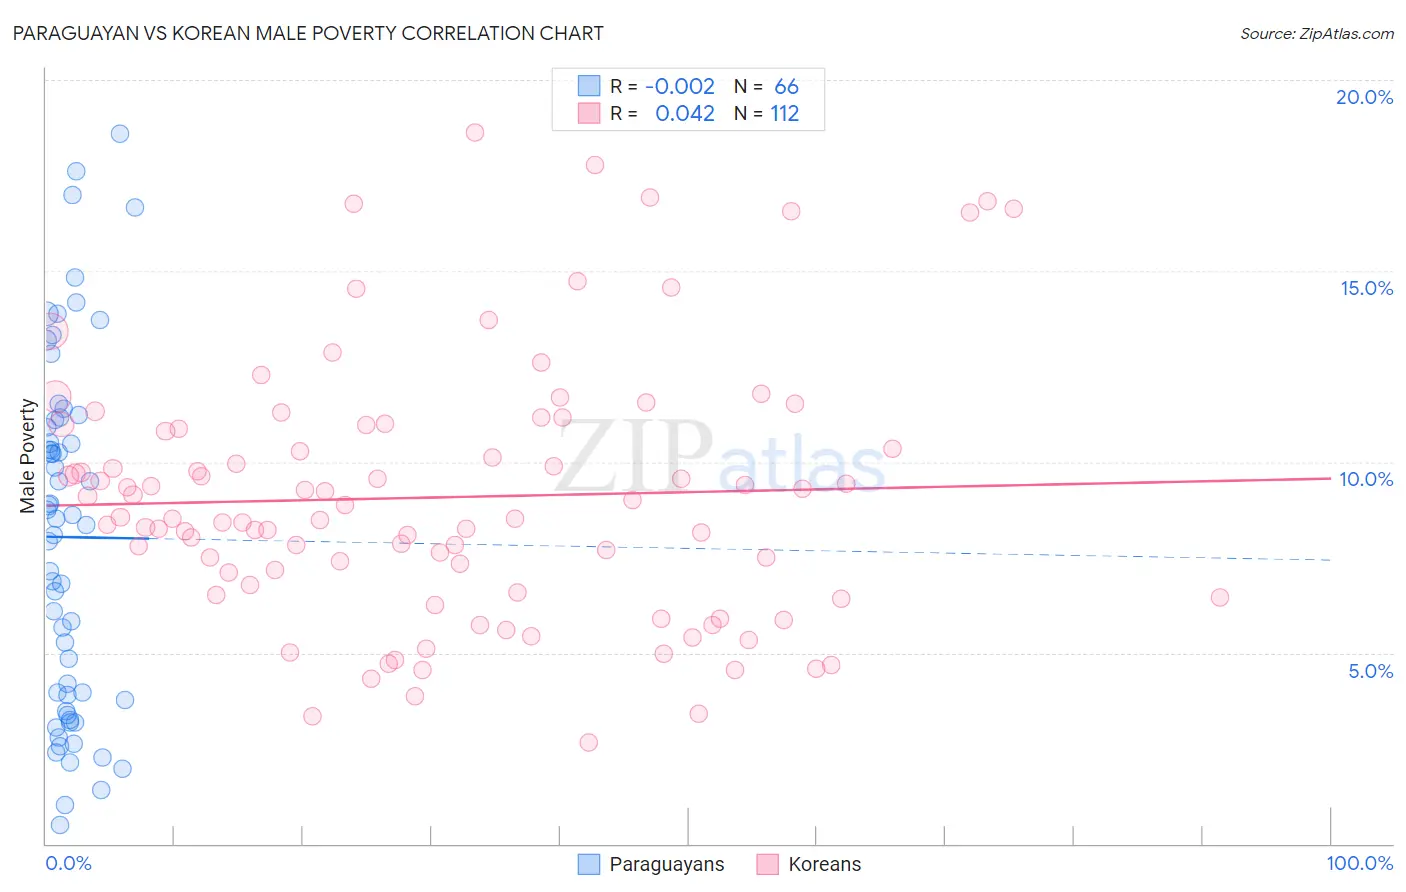
Paraguayan vs Korean Male Poverty Correlation Chart
The statistical analysis conducted on geographies consisting of 95,091,080 people shows no correlation between the proportion of Paraguayans and poverty level among males in the United States with a correlation coefficient (R) of -0.002 and weighted average of 10.2%. Similarly, the statistical analysis conducted on geographies consisting of 510,064,453 people shows no correlation between the proportion of Koreans and poverty level among males in the United States with a correlation coefficient (R) of 0.042 and weighted average of 9.9%, a difference of 3.6%.
Male Poverty Correlation Summary
| Measurement | Paraguayan | Korean |
| Minimum | 0.50% | 2.6% |
| Maximum | 18.6% | 18.6% |
| Range | 18.1% | 16.0% |
| Mean | 8.0% | 9.1% |
| Median | 8.4% | 8.5% |
| Interquartile 25% (IQ1) | 3.8% | 6.7% |
| Interquartile 75% (IQ3) | 11.1% | 10.9% |
| Interquartile Range (IQR) | 7.4% | 4.2% |
| Standard Deviation (Sample) | 4.6% | 3.4% |
| Standard Deviation (Population) | 4.5% | 3.4% |
Similar Demographics by Male Poverty
Demographics Similar to Paraguayans by Male Poverty
In terms of male poverty, the demographic groups most similar to Paraguayans are Immigrants from Australia (10.2%, a difference of 0.020%), European (10.2%, a difference of 0.030%), Immigrants from Canada (10.2%, a difference of 0.030%), Immigrants from Asia (10.2%, a difference of 0.12%), and Immigrants from Sri Lanka (10.2%, a difference of 0.15%).
| Demographics | Rating | Rank | Male Poverty |
| Slovaks | 97.7 /100 | #63 | Exceptional 10.2% |
| Swiss | 97.5 /100 | #64 | Exceptional 10.2% |
| Zimbabweans | 97.5 /100 | #65 | Exceptional 10.2% |
| Serbians | 97.5 /100 | #66 | Exceptional 10.2% |
| Immigrants | Netherlands | 97.3 /100 | #67 | Exceptional 10.2% |
| Immigrants | Sri Lanka | 97.2 /100 | #68 | Exceptional 10.2% |
| Immigrants | Australia | 97.1 /100 | #69 | Exceptional 10.2% |
| Paraguayans | 97.1 /100 | #70 | Exceptional 10.2% |
| Europeans | 97.1 /100 | #71 | Exceptional 10.2% |
| Immigrants | Canada | 97.1 /100 | #72 | Exceptional 10.2% |
| Immigrants | Asia | 97.0 /100 | #73 | Exceptional 10.2% |
| Immigrants | Eastern Europe | 96.9 /100 | #74 | Exceptional 10.2% |
| Carpatho Rusyns | 96.9 /100 | #75 | Exceptional 10.2% |
| Dutch | 96.9 /100 | #76 | Exceptional 10.2% |
| Immigrants | Belgium | 96.8 /100 | #77 | Exceptional 10.3% |
Demographics Similar to Koreans by Male Poverty
In terms of male poverty, the demographic groups most similar to Koreans are Cypriot (9.9%, a difference of 0.10%), Russian (9.9%, a difference of 0.17%), Immigrants from Pakistan (9.9%, a difference of 0.18%), Immigrants from Iran (9.9%, a difference of 0.24%), and Immigrants from Moldova (9.9%, a difference of 0.50%).
| Demographics | Rating | Rank | Male Poverty |
| Immigrants | Poland | 99.5 /100 | #34 | Exceptional 9.8% |
| Iranians | 99.4 /100 | #35 | Exceptional 9.8% |
| Czechs | 99.4 /100 | #36 | Exceptional 9.8% |
| Immigrants | Greece | 99.3 /100 | #37 | Exceptional 9.8% |
| Immigrants | Pakistan | 99.2 /100 | #38 | Exceptional 9.9% |
| Russians | 99.2 /100 | #39 | Exceptional 9.9% |
| Cypriots | 99.2 /100 | #40 | Exceptional 9.9% |
| Koreans | 99.2 /100 | #41 | Exceptional 9.9% |
| Immigrants | Iran | 99.1 /100 | #42 | Exceptional 9.9% |
| Immigrants | Moldova | 99.0 /100 | #43 | Exceptional 9.9% |
| Immigrants | Romania | 98.9 /100 | #44 | Exceptional 9.9% |
| Immigrants | Serbia | 98.9 /100 | #45 | Exceptional 10.0% |
| Turks | 98.9 /100 | #46 | Exceptional 10.0% |
| Immigrants | Singapore | 98.8 /100 | #47 | Exceptional 10.0% |
| Immigrants | Japan | 98.8 /100 | #48 | Exceptional 10.0% |