Paraguayan vs Immigrants from Sri Lanka Female Poverty
COMPARE
Paraguayan
Immigrants from Sri Lanka
Female Poverty
Female Poverty Comparison
Paraguayans
Immigrants from Sri Lanka
12.6%
FEMALE POVERTY
93.0/ 100
METRIC RATING
110th/ 347
METRIC RANK
12.1%
FEMALE POVERTY
98.5/ 100
METRIC RATING
55th/ 347
METRIC RANK
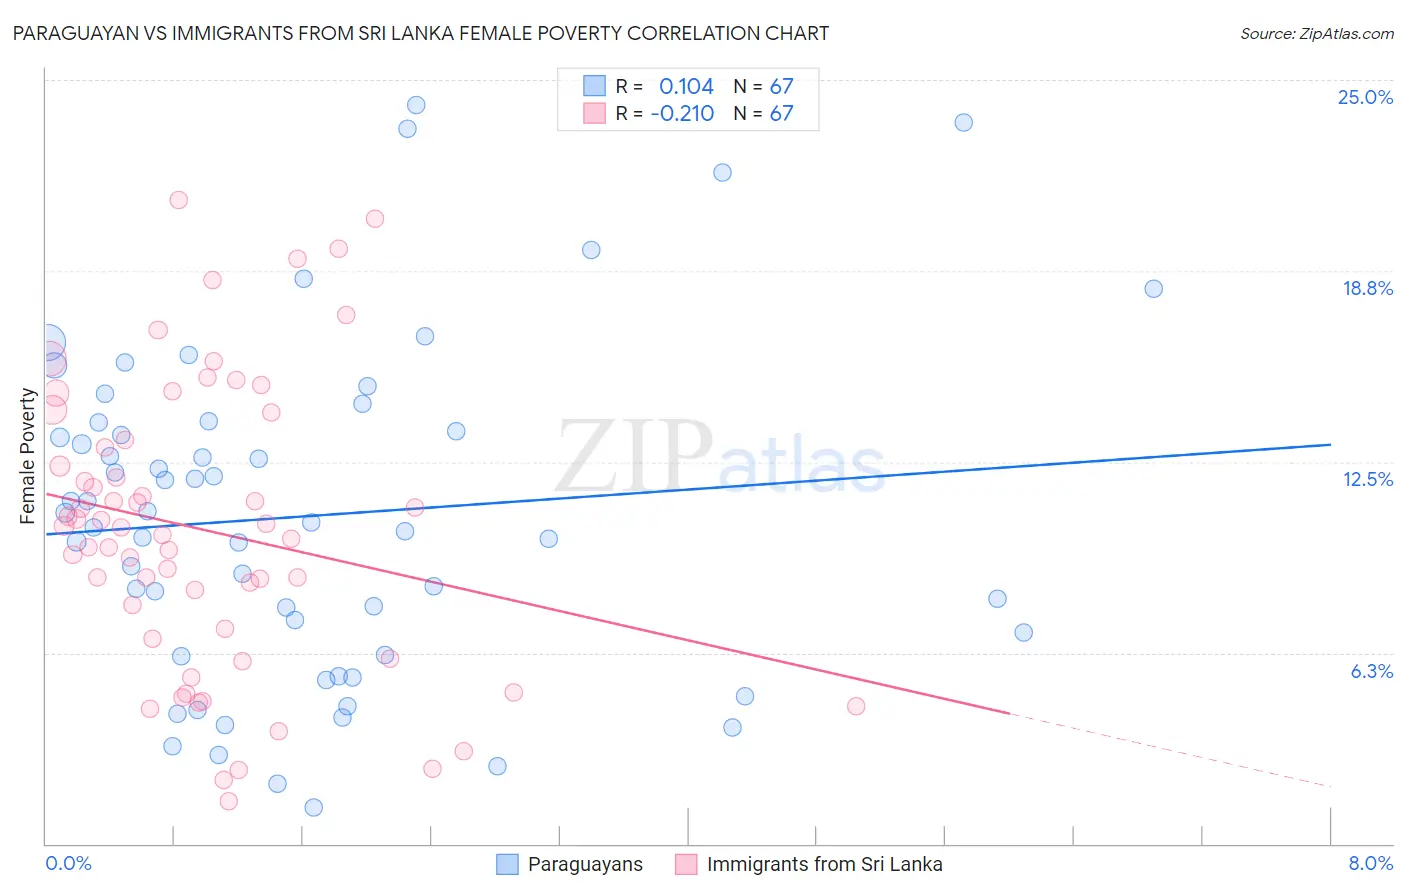
Paraguayan vs Immigrants from Sri Lanka Female Poverty Correlation Chart
The statistical analysis conducted on geographies consisting of 95,097,647 people shows a poor positive correlation between the proportion of Paraguayans and poverty level among females in the United States with a correlation coefficient (R) of 0.104 and weighted average of 12.6%. Similarly, the statistical analysis conducted on geographies consisting of 149,673,263 people shows a weak negative correlation between the proportion of Immigrants from Sri Lanka and poverty level among females in the United States with a correlation coefficient (R) of -0.210 and weighted average of 12.1%, a difference of 4.2%.
Female Poverty Correlation Summary
| Measurement | Paraguayan | Immigrants from Sri Lanka |
| Minimum | 1.2% | 1.4% |
| Maximum | 24.2% | 21.1% |
| Range | 23.0% | 19.7% |
| Mean | 10.7% | 10.3% |
| Median | 10.5% | 10.3% |
| Interquartile 25% (IQ1) | 6.2% | 6.7% |
| Interquartile 75% (IQ3) | 13.8% | 13.2% |
| Interquartile Range (IQR) | 7.6% | 6.5% |
| Standard Deviation (Sample) | 5.4% | 4.7% |
| Standard Deviation (Population) | 5.4% | 4.7% |
Similar Demographics by Female Poverty
Demographics Similar to Paraguayans by Female Poverty
In terms of female poverty, the demographic groups most similar to Paraguayans are Immigrants from Zimbabwe (12.6%, a difference of 0.030%), Portuguese (12.6%, a difference of 0.040%), Laotian (12.6%, a difference of 0.15%), Soviet Union (12.6%, a difference of 0.22%), and Immigrants from Turkey (12.6%, a difference of 0.33%).
| Demographics | Rating | Rank | Female Poverty |
| Slavs | 94.5 /100 | #103 | Exceptional 12.5% |
| Palestinians | 94.3 /100 | #104 | Exceptional 12.5% |
| Scottish | 94.1 /100 | #105 | Exceptional 12.5% |
| Immigrants | Turkey | 93.8 /100 | #106 | Exceptional 12.6% |
| Laotians | 93.4 /100 | #107 | Exceptional 12.6% |
| Portuguese | 93.1 /100 | #108 | Exceptional 12.6% |
| Immigrants | Zimbabwe | 93.1 /100 | #109 | Exceptional 12.6% |
| Paraguayans | 93.0 /100 | #110 | Exceptional 12.6% |
| Soviet Union | 92.4 /100 | #111 | Exceptional 12.6% |
| Immigrants | Israel | 92.0 /100 | #112 | Exceptional 12.6% |
| Canadians | 92.0 /100 | #113 | Exceptional 12.7% |
| Welsh | 91.6 /100 | #114 | Exceptional 12.7% |
| Puget Sound Salish | 91.5 /100 | #115 | Exceptional 12.7% |
| Immigrants | Russia | 91.2 /100 | #116 | Exceptional 12.7% |
| Immigrants | Southern Europe | 90.9 /100 | #117 | Exceptional 12.7% |
Demographics Similar to Immigrants from Sri Lanka by Female Poverty
In terms of female poverty, the demographic groups most similar to Immigrants from Sri Lanka are Estonian (12.1%, a difference of 0.25%), Immigrants from Serbia (12.1%, a difference of 0.31%), Immigrants from Philippines (12.1%, a difference of 0.35%), Scandinavian (12.1%, a difference of 0.39%), and Immigrants from Europe (12.1%, a difference of 0.40%).
| Demographics | Rating | Rank | Female Poverty |
| Immigrants | Japan | 99.0 /100 | #48 | Exceptional 11.9% |
| Immigrants | Romania | 99.0 /100 | #49 | Exceptional 12.0% |
| Slovenes | 98.9 /100 | #50 | Exceptional 12.0% |
| Immigrants | Bulgaria | 98.9 /100 | #51 | Exceptional 12.0% |
| Immigrants | Croatia | 98.7 /100 | #52 | Exceptional 12.0% |
| Immigrants | Austria | 98.7 /100 | #53 | Exceptional 12.0% |
| Immigrants | Philippines | 98.7 /100 | #54 | Exceptional 12.1% |
| Immigrants | Sri Lanka | 98.5 /100 | #55 | Exceptional 12.1% |
| Estonians | 98.3 /100 | #56 | Exceptional 12.1% |
| Immigrants | Serbia | 98.3 /100 | #57 | Exceptional 12.1% |
| Scandinavians | 98.2 /100 | #58 | Exceptional 12.1% |
| Immigrants | Europe | 98.2 /100 | #59 | Exceptional 12.1% |
| Immigrants | Australia | 98.1 /100 | #60 | Exceptional 12.2% |
| Immigrants | Asia | 98.1 /100 | #61 | Exceptional 12.2% |
| Immigrants | Italy | 98.0 /100 | #62 | Exceptional 12.2% |