Panamanian vs Hopi Child Poverty Among Boys Under 16
COMPARE
Panamanian
Hopi
Child Poverty Among Boys Under 16
Child Poverty Among Boys Under 16 Comparison
Panamanians
Hopi
17.7%
CHILD POVERTY AMONG BOYS UNDER 16
5.9/ 100
METRIC RATING
214th/ 347
METRIC RANK
25.9%
CHILD POVERTY AMONG BOYS UNDER 16
0.0/ 100
METRIC RATING
338th/ 347
METRIC RANK
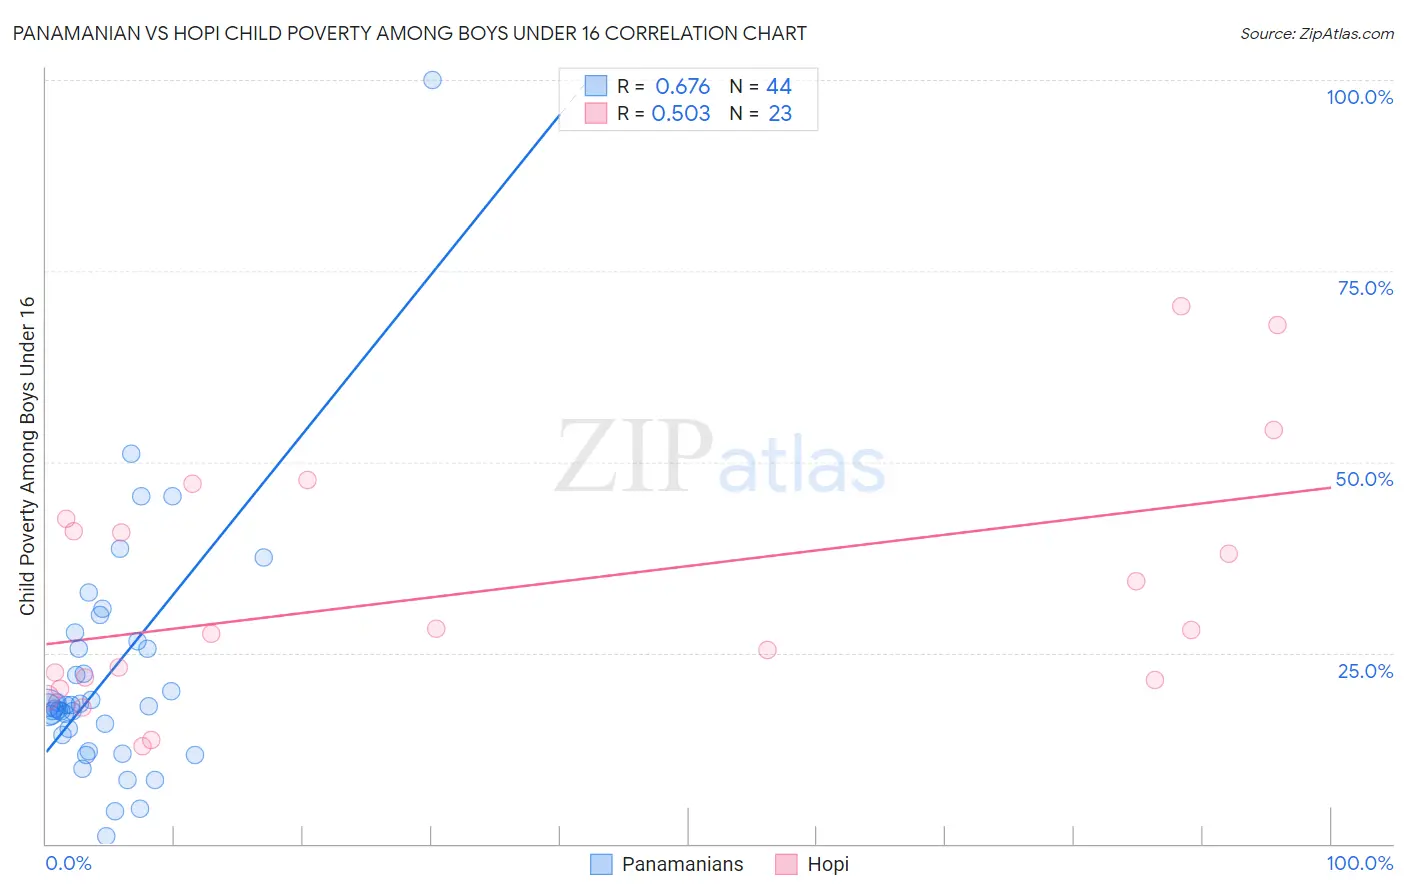
Panamanian vs Hopi Child Poverty Among Boys Under 16 Correlation Chart
The statistical analysis conducted on geographies consisting of 278,864,052 people shows a significant positive correlation between the proportion of Panamanians and poverty level among boys under the age of 16 in the United States with a correlation coefficient (R) of 0.676 and weighted average of 17.7%. Similarly, the statistical analysis conducted on geographies consisting of 74,636,845 people shows a substantial positive correlation between the proportion of Hopi and poverty level among boys under the age of 16 in the United States with a correlation coefficient (R) of 0.503 and weighted average of 25.9%, a difference of 46.6%.
Child Poverty Among Boys Under 16 Correlation Summary
| Measurement | Panamanian | Hopi |
| Minimum | 0.96% | 12.7% |
| Maximum | 100.0% | 70.4% |
| Range | 99.0% | 57.7% |
| Mean | 22.2% | 33.3% |
| Median | 18.1% | 28.1% |
| Interquartile 25% (IQ1) | 14.7% | 21.5% |
| Interquartile 75% (IQ3) | 26.0% | 42.6% |
| Interquartile Range (IQR) | 11.4% | 21.1% |
| Standard Deviation (Sample) | 16.2% | 16.1% |
| Standard Deviation (Population) | 16.0% | 15.7% |
Similar Demographics by Child Poverty Among Boys Under 16
Demographics Similar to Panamanians by Child Poverty Among Boys Under 16
In terms of child poverty among boys under 16, the demographic groups most similar to Panamanians are Immigrants from Eastern Africa (17.7%, a difference of 0.0%), Osage (17.7%, a difference of 0.070%), Moroccan (17.7%, a difference of 0.16%), Japanese (17.7%, a difference of 0.19%), and Iraqi (17.7%, a difference of 0.21%).
| Demographics | Rating | Rank | Child Poverty Among Boys Under 16 |
| Immigrants | Thailand | 8.2 /100 | #207 | Tragic 17.5% |
| Malaysians | 7.6 /100 | #208 | Tragic 17.6% |
| Alaskan Athabascans | 7.3 /100 | #209 | Tragic 17.6% |
| Immigrants | Armenia | 6.8 /100 | #210 | Tragic 17.6% |
| Immigrants | Immigrants | 6.7 /100 | #211 | Tragic 17.6% |
| Aleuts | 6.6 /100 | #212 | Tragic 17.7% |
| Immigrants | Eastern Africa | 6.0 /100 | #213 | Tragic 17.7% |
| Panamanians | 5.9 /100 | #214 | Tragic 17.7% |
| Osage | 5.8 /100 | #215 | Tragic 17.7% |
| Moroccans | 5.6 /100 | #216 | Tragic 17.7% |
| Japanese | 5.5 /100 | #217 | Tragic 17.7% |
| Iraqis | 5.5 /100 | #218 | Tragic 17.7% |
| Sierra Leoneans | 5.3 /100 | #219 | Tragic 17.8% |
| Immigrants | Cambodia | 5.1 /100 | #220 | Tragic 17.8% |
| Immigrants | Panama | 4.3 /100 | #221 | Tragic 17.9% |
Demographics Similar to Hopi by Child Poverty Among Boys Under 16
In terms of child poverty among boys under 16, the demographic groups most similar to Hopi are Cheyenne (25.8%, a difference of 0.51%), Houma (26.2%, a difference of 1.0%), Crow (26.3%, a difference of 1.2%), Sioux (25.3%, a difference of 2.5%), and Yup'ik (24.7%, a difference of 4.9%).
| Demographics | Rating | Rank | Child Poverty Among Boys Under 16 |
| Dominicans | 0.0 /100 | #331 | Tragic 24.2% |
| Immigrants | Dominican Republic | 0.0 /100 | #332 | Tragic 24.3% |
| Apache | 0.0 /100 | #333 | Tragic 24.5% |
| Blacks/African Americans | 0.0 /100 | #334 | Tragic 24.5% |
| Yup'ik | 0.0 /100 | #335 | Tragic 24.7% |
| Sioux | 0.0 /100 | #336 | Tragic 25.3% |
| Cheyenne | 0.0 /100 | #337 | Tragic 25.8% |
| Hopi | 0.0 /100 | #338 | Tragic 25.9% |
| Houma | 0.0 /100 | #339 | Tragic 26.2% |
| Crow | 0.0 /100 | #340 | Tragic 26.3% |
| Immigrants | Yemen | 0.0 /100 | #341 | Tragic 28.9% |
| Pima | 0.0 /100 | #342 | Tragic 29.7% |
| Navajo | 0.0 /100 | #343 | Tragic 30.3% |
| Yuman | 0.0 /100 | #344 | Tragic 30.6% |
| Tohono O'odham | 0.0 /100 | #345 | Tragic 31.6% |