Paiute vs Afghan Single Male Poverty
COMPARE
Paiute
Afghan
Single Male Poverty
Single Male Poverty Comparison
Paiute
Afghans
19.3%
SINGLE MALE POVERTY
0.0/ 100
METRIC RATING
331st/ 347
METRIC RANK
10.7%
SINGLE MALE POVERTY
100.0/ 100
METRIC RATING
7th/ 347
METRIC RANK
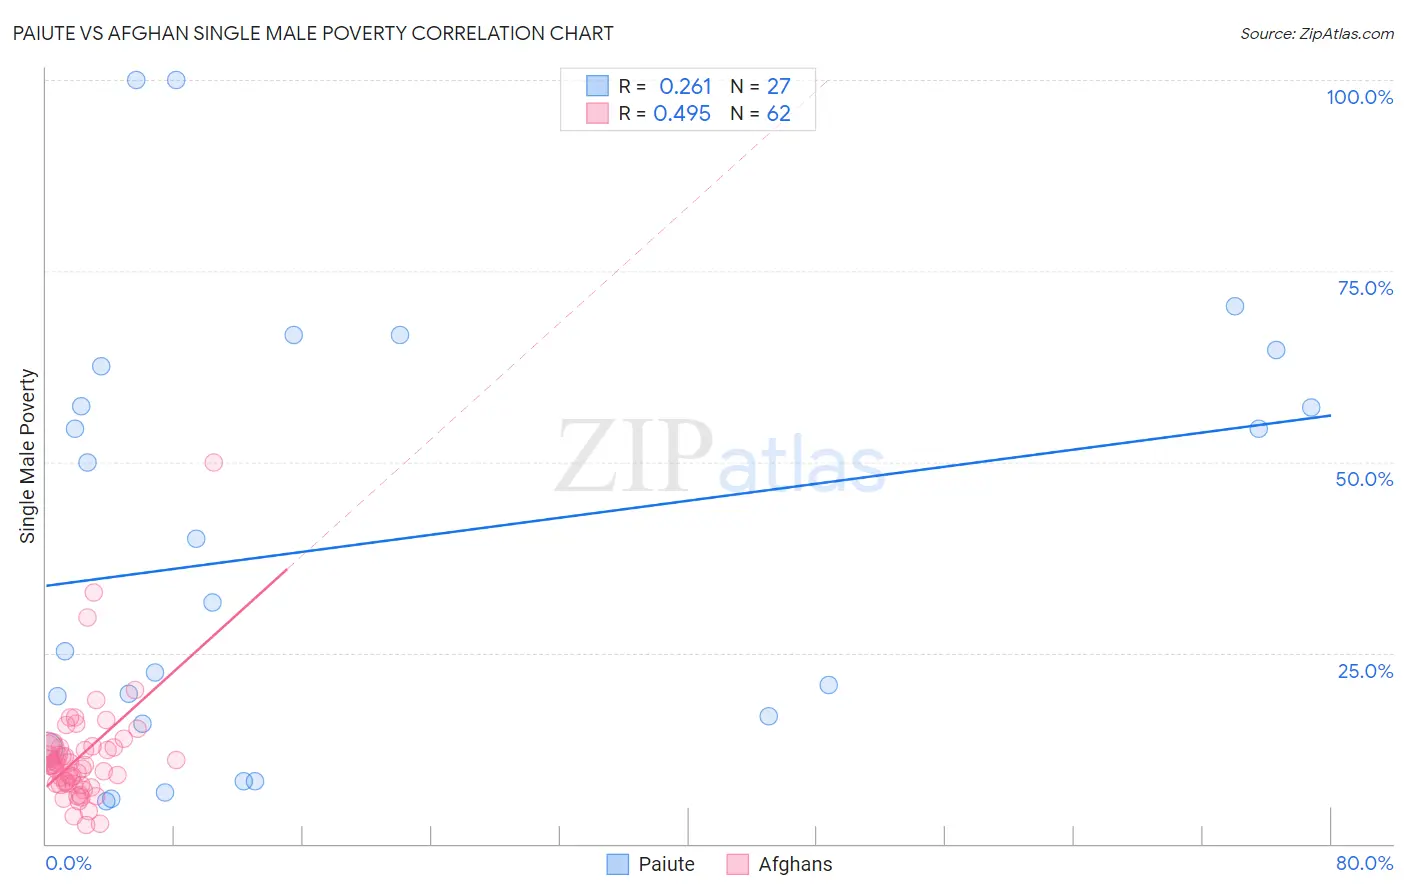
Paiute vs Afghan Single Male Poverty Correlation Chart
The statistical analysis conducted on geographies consisting of 56,714,476 people shows a weak positive correlation between the proportion of Paiute and poverty level among single males in the United States with a correlation coefficient (R) of 0.261 and weighted average of 19.3%. Similarly, the statistical analysis conducted on geographies consisting of 140,679,200 people shows a moderate positive correlation between the proportion of Afghans and poverty level among single males in the United States with a correlation coefficient (R) of 0.495 and weighted average of 10.7%, a difference of 80.2%.
Single Male Poverty Correlation Summary
| Measurement | Paiute | Afghan |
| Minimum | 5.6% | 2.4% |
| Maximum | 100.0% | 50.0% |
| Range | 94.4% | 47.6% |
| Mean | 39.3% | 11.5% |
| Median | 31.7% | 10.3% |
| Interquartile 25% (IQ1) | 15.8% | 7.8% |
| Interquartile 75% (IQ3) | 62.5% | 12.6% |
| Interquartile Range (IQR) | 46.7% | 4.8% |
| Standard Deviation (Sample) | 28.4% | 7.2% |
| Standard Deviation (Population) | 27.9% | 7.2% |
Similar Demographics by Single Male Poverty
Demographics Similar to Paiute by Single Male Poverty
In terms of single male poverty, the demographic groups most similar to Paiute are Cajun (19.1%, a difference of 1.1%), Native/Alaskan (19.6%, a difference of 1.7%), Inupiat (20.0%, a difference of 3.6%), Pima (20.2%, a difference of 4.4%), and Colville (18.4%, a difference of 4.6%).
| Demographics | Rating | Rank | Single Male Poverty |
| Immigrants | Yemen | 0.0 /100 | #324 | Tragic 16.9% |
| Choctaw | 0.0 /100 | #325 | Tragic 17.0% |
| Central American Indians | 0.0 /100 | #326 | Tragic 17.2% |
| Menominee | 0.0 /100 | #327 | Tragic 17.7% |
| Kiowa | 0.0 /100 | #328 | Tragic 18.3% |
| Colville | 0.0 /100 | #329 | Tragic 18.4% |
| Cajuns | 0.0 /100 | #330 | Tragic 19.1% |
| Paiute | 0.0 /100 | #331 | Tragic 19.3% |
| Natives/Alaskans | 0.0 /100 | #332 | Tragic 19.6% |
| Inupiat | 0.0 /100 | #333 | Tragic 20.0% |
| Pima | 0.0 /100 | #334 | Tragic 20.2% |
| Yuman | 0.0 /100 | #335 | Tragic 21.3% |
| Tohono O'odham | 0.0 /100 | #336 | Tragic 21.6% |
| Apache | 0.0 /100 | #337 | Tragic 21.6% |
| Pueblo | 0.0 /100 | #338 | Tragic 21.6% |
Demographics Similar to Afghans by Single Male Poverty
In terms of single male poverty, the demographic groups most similar to Afghans are Thai (10.8%, a difference of 0.47%), Filipino (10.6%, a difference of 0.75%), Taiwanese (10.9%, a difference of 1.7%), Immigrants from Fiji (10.9%, a difference of 1.8%), and Immigrants from Philippines (10.9%, a difference of 1.8%).
| Demographics | Rating | Rank | Single Male Poverty |
| Assyrians/Chaldeans/Syriacs | 100.0 /100 | #1 | Exceptional 9.8% |
| Immigrants | Taiwan | 100.0 /100 | #2 | Exceptional 10.3% |
| Immigrants | India | 100.0 /100 | #3 | Exceptional 10.3% |
| Immigrants | Hong Kong | 100.0 /100 | #4 | Exceptional 10.4% |
| Tongans | 100.0 /100 | #5 | Exceptional 10.5% |
| Filipinos | 100.0 /100 | #6 | Exceptional 10.6% |
| Afghans | 100.0 /100 | #7 | Exceptional 10.7% |
| Thais | 100.0 /100 | #8 | Exceptional 10.8% |
| Taiwanese | 100.0 /100 | #9 | Exceptional 10.9% |
| Immigrants | Fiji | 100.0 /100 | #10 | Exceptional 10.9% |
| Immigrants | Philippines | 100.0 /100 | #11 | Exceptional 10.9% |
| Immigrants | Afghanistan | 100.0 /100 | #12 | Exceptional 10.9% |
| Immigrants | South Central Asia | 100.0 /100 | #13 | Exceptional 10.9% |
| Chinese | 100.0 /100 | #14 | Exceptional 11.0% |
| Koreans | 100.0 /100 | #15 | Exceptional 11.0% |