Osage vs Menominee Single Father Poverty
COMPARE
Osage
Menominee
Single Father Poverty
Single Father Poverty Comparison
Osage
Menominee
19.0%
SINGLE FATHER POVERTY
0.0/ 100
METRIC RATING
316th/ 347
METRIC RANK
16.8%
SINGLE FATHER POVERTY
6.4/ 100
METRIC RATING
225th/ 347
METRIC RANK
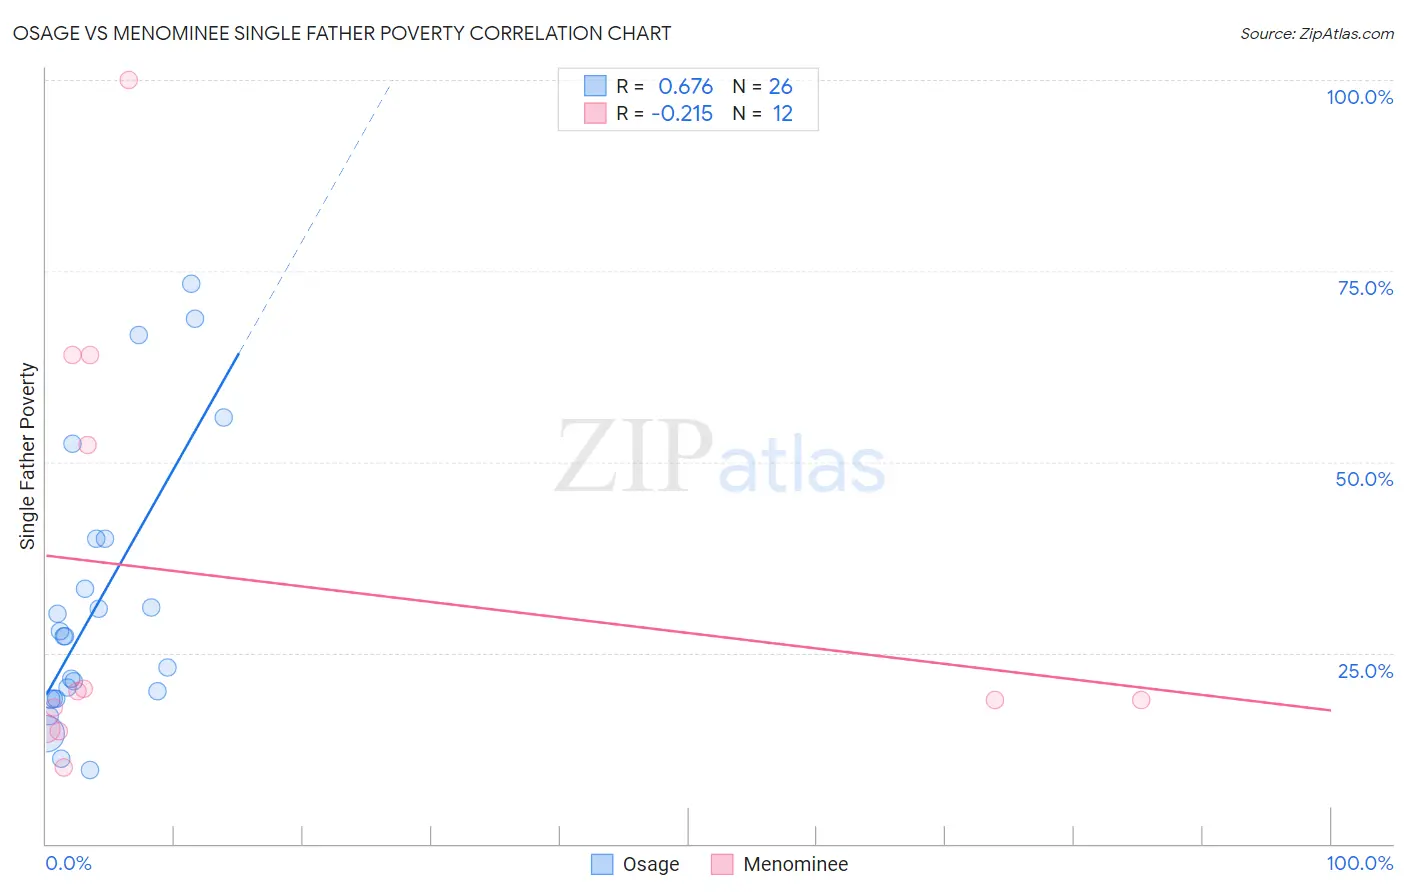
Osage vs Menominee Single Father Poverty Correlation Chart
The statistical analysis conducted on geographies consisting of 82,975,637 people shows a significant positive correlation between the proportion of Osage and poverty level among single fathers in the United States with a correlation coefficient (R) of 0.676 and weighted average of 19.0%. Similarly, the statistical analysis conducted on geographies consisting of 42,801,282 people shows a weak negative correlation between the proportion of Menominee and poverty level among single fathers in the United States with a correlation coefficient (R) of -0.215 and weighted average of 16.8%, a difference of 13.4%.
Single Father Poverty Correlation Summary
| Measurement | Osage | Menominee |
| Minimum | 9.7% | 9.9% |
| Maximum | 73.3% | 100.0% |
| Range | 63.7% | 90.1% |
| Mean | 31.5% | 34.6% |
| Median | 27.1% | 19.4% |
| Interquartile 25% (IQ1) | 19.0% | 16.4% |
| Interquartile 75% (IQ3) | 40.0% | 58.1% |
| Interquartile Range (IQR) | 21.0% | 41.7% |
| Standard Deviation (Sample) | 17.9% | 28.5% |
| Standard Deviation (Population) | 17.5% | 27.2% |
Similar Demographics by Single Father Poverty
Demographics Similar to Osage by Single Father Poverty
In terms of single father poverty, the demographic groups most similar to Osage are Dominican (19.1%, a difference of 0.31%), Chickasaw (19.0%, a difference of 0.40%), Delaware (18.9%, a difference of 0.56%), Potawatomi (18.9%, a difference of 0.72%), and Dutch West Indian (19.2%, a difference of 0.89%).
| Demographics | Rating | Rank | Single Father Poverty |
| Immigrants | Micronesia | 0.0 /100 | #309 | Tragic 18.6% |
| Chippewa | 0.0 /100 | #310 | Tragic 18.8% |
| Immigrants | Nonimmigrants | 0.0 /100 | #311 | Tragic 18.8% |
| Immigrants | Dominica | 0.0 /100 | #312 | Tragic 18.9% |
| Potawatomi | 0.0 /100 | #313 | Tragic 18.9% |
| Delaware | 0.0 /100 | #314 | Tragic 18.9% |
| Chickasaw | 0.0 /100 | #315 | Tragic 19.0% |
| Osage | 0.0 /100 | #316 | Tragic 19.0% |
| Dominicans | 0.0 /100 | #317 | Tragic 19.1% |
| Dutch West Indians | 0.0 /100 | #318 | Tragic 19.2% |
| Slovaks | 0.0 /100 | #319 | Tragic 19.3% |
| Inupiat | 0.0 /100 | #320 | Tragic 19.5% |
| Cherokee | 0.0 /100 | #321 | Tragic 19.6% |
| Creek | 0.0 /100 | #322 | Tragic 19.8% |
| Pennsylvania Germans | 0.0 /100 | #323 | Tragic 20.0% |
Demographics Similar to Menominee by Single Father Poverty
In terms of single father poverty, the demographic groups most similar to Menominee are Immigrants from Norway (16.8%, a difference of 0.020%), Hispanic or Latino (16.8%, a difference of 0.050%), Immigrants from Austria (16.8%, a difference of 0.10%), British (16.8%, a difference of 0.15%), and Belgian (16.8%, a difference of 0.21%).
| Demographics | Rating | Rank | Single Father Poverty |
| Immigrants | Uganda | 8.6 /100 | #218 | Tragic 16.7% |
| Immigrants | Ghana | 8.1 /100 | #219 | Tragic 16.7% |
| Immigrants | Denmark | 8.1 /100 | #220 | Tragic 16.7% |
| Immigrants | Greece | 8.1 /100 | #221 | Tragic 16.7% |
| Immigrants | Spain | 8.0 /100 | #222 | Tragic 16.7% |
| Immigrants | Austria | 7.0 /100 | #223 | Tragic 16.8% |
| Immigrants | Norway | 6.5 /100 | #224 | Tragic 16.8% |
| Menominee | 6.4 /100 | #225 | Tragic 16.8% |
| Hispanics or Latinos | 6.1 /100 | #226 | Tragic 16.8% |
| British | 5.6 /100 | #227 | Tragic 16.8% |
| Belgians | 5.3 /100 | #228 | Tragic 16.8% |
| Israelis | 4.6 /100 | #229 | Tragic 16.8% |
| Immigrants | Trinidad and Tobago | 4.5 /100 | #230 | Tragic 16.8% |
| Spanish Americans | 3.7 /100 | #231 | Tragic 16.9% |
| Immigrants | Grenada | 3.7 /100 | #232 | Tragic 16.9% |