Osage vs Immigrants from Grenada Child Poverty Under the Age of 5
COMPARE
Osage
Immigrants from Grenada
Child Poverty Under the Age of 5
Child Poverty Under the Age of 5 Comparison
Osage
Immigrants from Grenada
19.6%
CHILD POVERTY UNDER THE AGE OF 5
0.5/ 100
METRIC RATING
243rd/ 347
METRIC RANK
20.7%
CHILD POVERTY UNDER THE AGE OF 5
0.0/ 100
METRIC RATING
278th/ 347
METRIC RANK
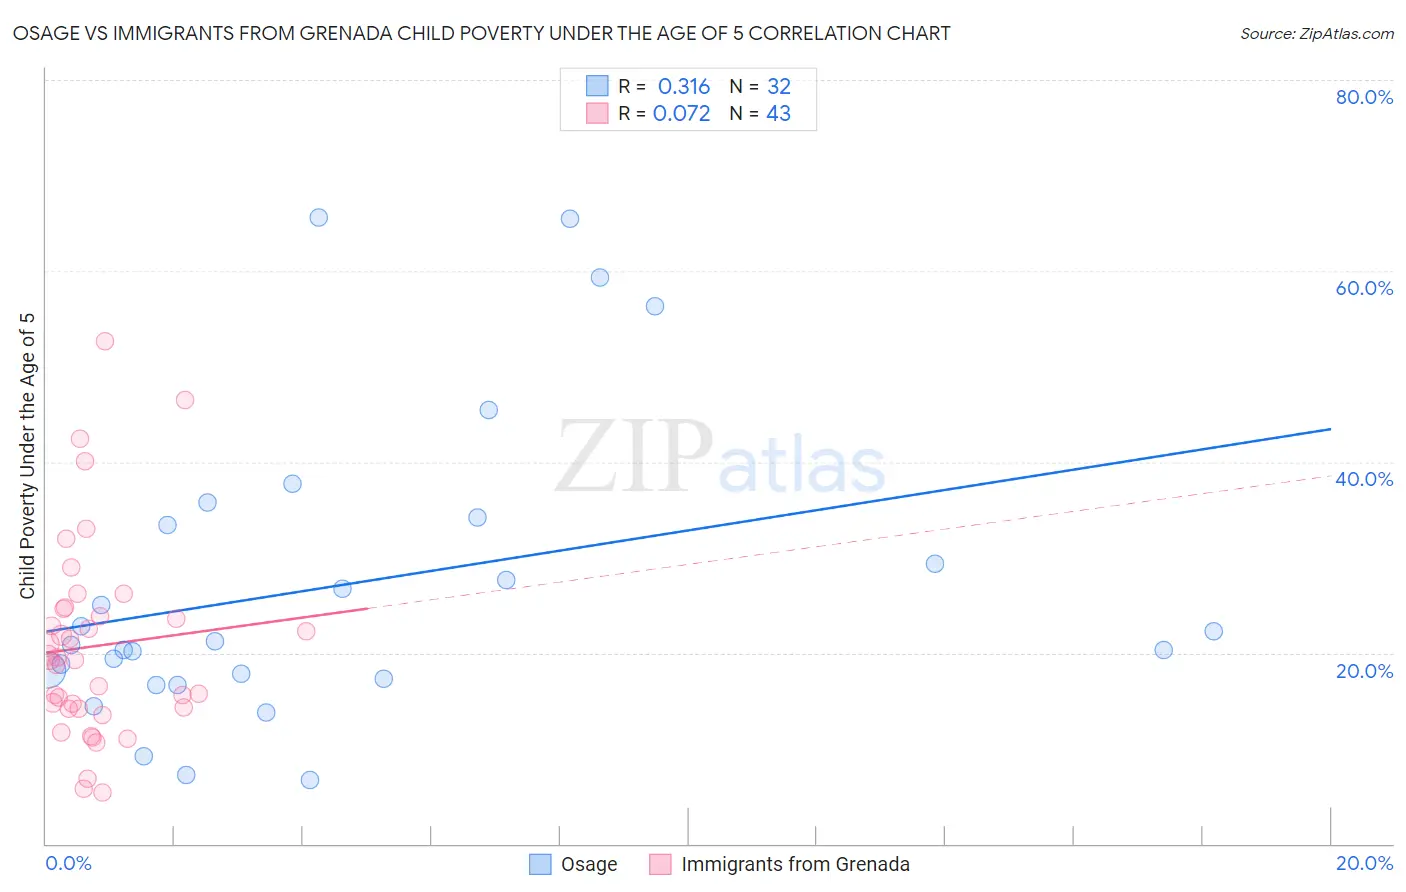
Osage vs Immigrants from Grenada Child Poverty Under the Age of 5 Correlation Chart
The statistical analysis conducted on geographies consisting of 90,936,218 people shows a mild positive correlation between the proportion of Osage and poverty level among children under the age of 5 in the United States with a correlation coefficient (R) of 0.316 and weighted average of 19.6%. Similarly, the statistical analysis conducted on geographies consisting of 66,612,136 people shows a slight positive correlation between the proportion of Immigrants from Grenada and poverty level among children under the age of 5 in the United States with a correlation coefficient (R) of 0.072 and weighted average of 20.7%, a difference of 5.3%.
Child Poverty Under the Age of 5 Correlation Summary
| Measurement | Osage | Immigrants from Grenada |
| Minimum | 6.7% | 5.4% |
| Maximum | 65.6% | 52.7% |
| Range | 59.0% | 47.3% |
| Mean | 27.0% | 20.7% |
| Median | 21.0% | 19.3% |
| Interquartile 25% (IQ1) | 17.5% | 14.2% |
| Interquartile 75% (IQ3) | 33.8% | 24.7% |
| Interquartile Range (IQR) | 16.2% | 10.5% |
| Standard Deviation (Sample) | 15.9% | 10.3% |
| Standard Deviation (Population) | 15.6% | 10.2% |
Similar Demographics by Child Poverty Under the Age of 5
Demographics Similar to Osage by Child Poverty Under the Age of 5
In terms of child poverty under the age of 5, the demographic groups most similar to Osage are Immigrants from Ghana (19.6%, a difference of 0.020%), Immigrants from Guyana (19.6%, a difference of 0.10%), Immigrants from Western Africa (19.7%, a difference of 0.21%), Alaska Native (19.6%, a difference of 0.22%), and Immigrants from Ecuador (19.6%, a difference of 0.28%).
| Demographics | Rating | Rank | Child Poverty Under the Age of 5 |
| Immigrants | Trinidad and Tobago | 0.8 /100 | #236 | Tragic 19.4% |
| Immigrants | Cabo Verde | 0.6 /100 | #237 | Tragic 19.5% |
| Salvadorans | 0.6 /100 | #238 | Tragic 19.5% |
| Vietnamese | 0.6 /100 | #239 | Tragic 19.5% |
| Immigrants | Ecuador | 0.5 /100 | #240 | Tragic 19.6% |
| Alaska Natives | 0.5 /100 | #241 | Tragic 19.6% |
| Immigrants | Guyana | 0.5 /100 | #242 | Tragic 19.6% |
| Osage | 0.5 /100 | #243 | Tragic 19.6% |
| Immigrants | Ghana | 0.5 /100 | #244 | Tragic 19.6% |
| Immigrants | Western Africa | 0.4 /100 | #245 | Tragic 19.7% |
| Cree | 0.4 /100 | #246 | Tragic 19.7% |
| Guyanese | 0.4 /100 | #247 | Tragic 19.7% |
| Marshallese | 0.4 /100 | #248 | Tragic 19.7% |
| Immigrants | Middle Africa | 0.4 /100 | #249 | Tragic 19.7% |
| Immigrants | Nonimmigrants | 0.4 /100 | #250 | Tragic 19.7% |
Demographics Similar to Immigrants from Grenada by Child Poverty Under the Age of 5
In terms of child poverty under the age of 5, the demographic groups most similar to Immigrants from Grenada are Immigrants from West Indies (20.7%, a difference of 0.020%), West Indian (20.6%, a difference of 0.19%), Bangladeshi (20.6%, a difference of 0.28%), Immigrants from Belize (20.6%, a difference of 0.33%), and Subsaharan African (20.8%, a difference of 0.37%).
| Demographics | Rating | Rank | Child Poverty Under the Age of 5 |
| Americans | 0.1 /100 | #271 | Tragic 20.5% |
| Immigrants | Jamaica | 0.1 /100 | #272 | Tragic 20.5% |
| Central Americans | 0.1 /100 | #273 | Tragic 20.6% |
| Immigrants | Belize | 0.1 /100 | #274 | Tragic 20.6% |
| Bangladeshis | 0.1 /100 | #275 | Tragic 20.6% |
| West Indians | 0.0 /100 | #276 | Tragic 20.6% |
| Immigrants | West Indies | 0.0 /100 | #277 | Tragic 20.7% |
| Immigrants | Grenada | 0.0 /100 | #278 | Tragic 20.7% |
| Sub-Saharan Africans | 0.0 /100 | #279 | Tragic 20.8% |
| French American Indians | 0.0 /100 | #280 | Tragic 20.8% |
| Senegalese | 0.0 /100 | #281 | Tragic 20.9% |
| Potawatomi | 0.0 /100 | #282 | Tragic 21.0% |
| Comanche | 0.0 /100 | #283 | Tragic 21.0% |
| Somalis | 0.0 /100 | #284 | Tragic 21.1% |
| Haitians | 0.0 /100 | #285 | Tragic 21.2% |