Osage vs Guatemalan Seniors Poverty Over the Age of 75
COMPARE
Osage
Guatemalan
Seniors Poverty Over the Age of 75
Seniors Poverty Over the Age of 75 Comparison
Osage
Guatemalans
11.4%
SENIORS POVERTY OVER THE AGE OF 75
96.3/ 100
METRIC RATING
71st/ 347
METRIC RANK
14.8%
SENIORS POVERTY OVER THE AGE OF 75
0.0/ 100
METRIC RATING
283rd/ 347
METRIC RANK
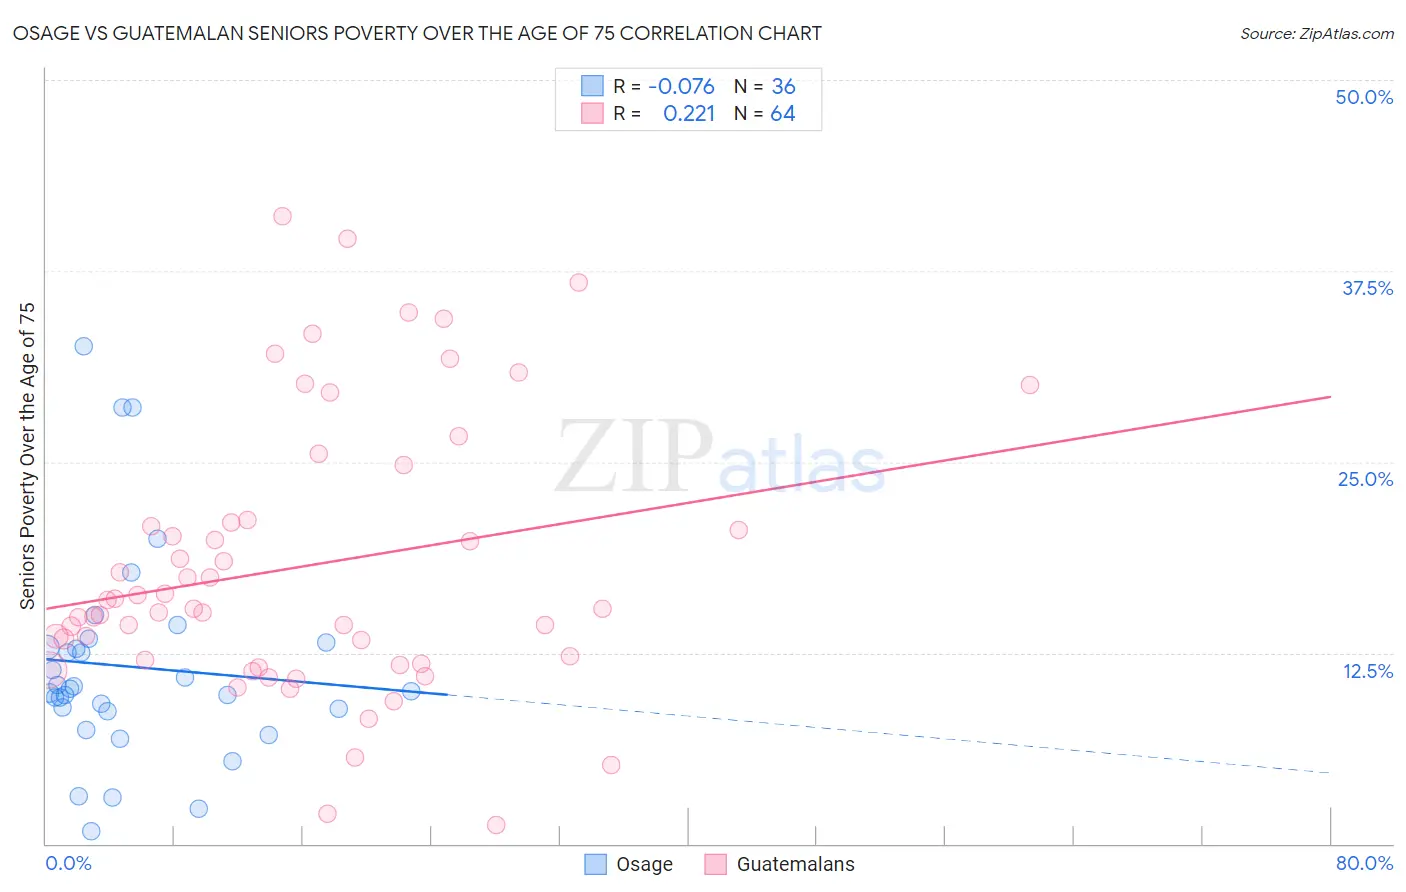
Osage vs Guatemalan Seniors Poverty Over the Age of 75 Correlation Chart
The statistical analysis conducted on geographies consisting of 91,517,033 people shows a slight negative correlation between the proportion of Osage and poverty level among seniors over the age of 75 in the United States with a correlation coefficient (R) of -0.076 and weighted average of 11.4%. Similarly, the statistical analysis conducted on geographies consisting of 405,055,105 people shows a weak positive correlation between the proportion of Guatemalans and poverty level among seniors over the age of 75 in the United States with a correlation coefficient (R) of 0.221 and weighted average of 14.8%, a difference of 30.0%.
Seniors Poverty Over the Age of 75 Correlation Summary
| Measurement | Osage | Guatemalan |
| Minimum | 0.78% | 1.2% |
| Maximum | 32.6% | 41.1% |
| Range | 31.8% | 39.8% |
| Mean | 11.6% | 18.2% |
| Median | 10.1% | 15.4% |
| Interquartile 25% (IQ1) | 8.8% | 11.9% |
| Interquartile 75% (IQ3) | 13.0% | 21.1% |
| Interquartile Range (IQR) | 4.2% | 9.2% |
| Standard Deviation (Sample) | 6.9% | 9.0% |
| Standard Deviation (Population) | 6.8% | 8.9% |
Similar Demographics by Seniors Poverty Over the Age of 75
Demographics Similar to Osage by Seniors Poverty Over the Age of 75
In terms of seniors poverty over the age of 75, the demographic groups most similar to Osage are Immigrants from South Central Asia (11.4%, a difference of 0.080%), Sierra Leonean (11.4%, a difference of 0.10%), Ottawa (11.4%, a difference of 0.11%), Immigrants from Austria (11.4%, a difference of 0.12%), and Bolivian (11.4%, a difference of 0.15%).
| Demographics | Rating | Rank | Seniors Poverty Over the Age of 75 |
| Immigrants | Northern Europe | 97.4 /100 | #64 | Exceptional 11.3% |
| Immigrants | Taiwan | 96.7 /100 | #65 | Exceptional 11.4% |
| Estonians | 96.7 /100 | #66 | Exceptional 11.4% |
| Bolivians | 96.5 /100 | #67 | Exceptional 11.4% |
| Immigrants | Austria | 96.5 /100 | #68 | Exceptional 11.4% |
| Ottawa | 96.5 /100 | #69 | Exceptional 11.4% |
| Immigrants | South Central Asia | 96.4 /100 | #70 | Exceptional 11.4% |
| Osage | 96.3 /100 | #71 | Exceptional 11.4% |
| Sierra Leoneans | 96.1 /100 | #72 | Exceptional 11.4% |
| Immigrants | Micronesia | 96.0 /100 | #73 | Exceptional 11.4% |
| Delaware | 96.0 /100 | #74 | Exceptional 11.4% |
| Palestinians | 95.8 /100 | #75 | Exceptional 11.4% |
| French Canadians | 95.7 /100 | #76 | Exceptional 11.4% |
| Whites/Caucasians | 95.5 /100 | #77 | Exceptional 11.4% |
| Macedonians | 95.5 /100 | #78 | Exceptional 11.4% |
Demographics Similar to Guatemalans by Seniors Poverty Over the Age of 75
In terms of seniors poverty over the age of 75, the demographic groups most similar to Guatemalans are Immigrants from Senegal (14.8%, a difference of 0.060%), Belizean (14.8%, a difference of 0.24%), Central American (14.7%, a difference of 0.35%), Cheyenne (14.9%, a difference of 0.64%), and Immigrants from Mexico (14.9%, a difference of 0.83%).
| Demographics | Rating | Rank | Seniors Poverty Over the Age of 75 |
| Soviet Union | 0.0 /100 | #276 | Tragic 14.5% |
| Senegalese | 0.0 /100 | #277 | Tragic 14.5% |
| Immigrants | Colombia | 0.0 /100 | #278 | Tragic 14.6% |
| Blacks/African Americans | 0.0 /100 | #279 | Tragic 14.6% |
| Central Americans | 0.0 /100 | #280 | Tragic 14.7% |
| Belizeans | 0.0 /100 | #281 | Tragic 14.8% |
| Immigrants | Senegal | 0.0 /100 | #282 | Tragic 14.8% |
| Guatemalans | 0.0 /100 | #283 | Tragic 14.8% |
| Cheyenne | 0.0 /100 | #284 | Tragic 14.9% |
| Immigrants | Mexico | 0.0 /100 | #285 | Tragic 14.9% |
| Immigrants | Central America | 0.0 /100 | #286 | Tragic 15.0% |
| Immigrants | Guatemala | 0.0 /100 | #287 | Tragic 15.1% |
| Jamaicans | 0.0 /100 | #288 | Tragic 15.1% |
| Immigrants | Belize | 0.0 /100 | #289 | Tragic 15.2% |
| Immigrants | Azores | 0.0 /100 | #290 | Tragic 15.2% |