Okinawan vs Immigrants from Ethiopia Child Poverty Under the Age of 5
COMPARE
Okinawan
Immigrants from Ethiopia
Child Poverty Under the Age of 5
Child Poverty Under the Age of 5 Comparison
Okinawans
Immigrants from Ethiopia
13.4%
CHILD POVERTY UNDER THE AGE OF 5
100.0/ 100
METRIC RATING
14th/ 347
METRIC RANK
16.6%
CHILD POVERTY UNDER THE AGE OF 5
82.1/ 100
METRIC RATING
145th/ 347
METRIC RANK
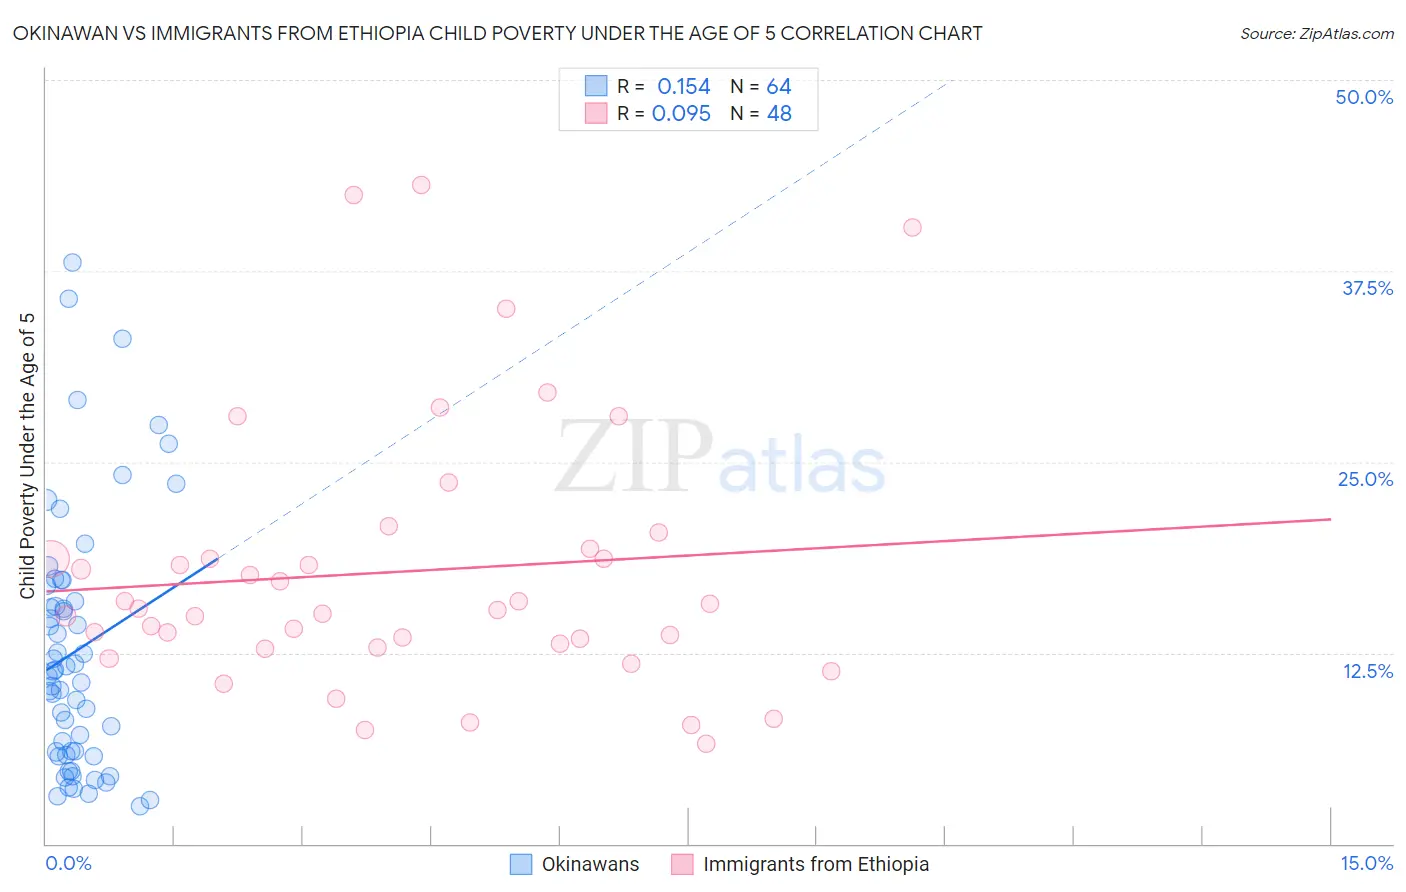
Okinawan vs Immigrants from Ethiopia Child Poverty Under the Age of 5 Correlation Chart
The statistical analysis conducted on geographies consisting of 72,437,494 people shows a poor positive correlation between the proportion of Okinawans and poverty level among children under the age of 5 in the United States with a correlation coefficient (R) of 0.154 and weighted average of 13.4%. Similarly, the statistical analysis conducted on geographies consisting of 207,314,219 people shows a slight positive correlation between the proportion of Immigrants from Ethiopia and poverty level among children under the age of 5 in the United States with a correlation coefficient (R) of 0.095 and weighted average of 16.6%, a difference of 23.1%.
Child Poverty Under the Age of 5 Correlation Summary
| Measurement | Okinawan | Immigrants from Ethiopia |
| Minimum | 2.5% | 6.5% |
| Maximum | 38.1% | 43.1% |
| Range | 35.6% | 36.6% |
| Mean | 12.6% | 17.8% |
| Median | 11.1% | 15.3% |
| Interquartile 25% (IQ1) | 5.9% | 13.0% |
| Interquartile 75% (IQ3) | 16.4% | 19.0% |
| Interquartile Range (IQR) | 10.5% | 6.0% |
| Standard Deviation (Sample) | 8.4% | 8.7% |
| Standard Deviation (Population) | 8.3% | 8.6% |
Similar Demographics by Child Poverty Under the Age of 5
Demographics Similar to Okinawans by Child Poverty Under the Age of 5
In terms of child poverty under the age of 5, the demographic groups most similar to Okinawans are Indian (Asian) (13.4%, a difference of 0.050%), Immigrants from Eastern Asia (13.5%, a difference of 0.57%), Bhutanese (13.4%, a difference of 0.65%), Assyrian/Chaldean/Syriac (13.6%, a difference of 0.91%), and Immigrants from China (13.6%, a difference of 1.2%).
| Demographics | Rating | Rank | Child Poverty Under the Age of 5 |
| Chinese | 100.0 /100 | #7 | Exceptional 13.1% |
| Iranians | 100.0 /100 | #8 | Exceptional 13.1% |
| Immigrants | Iran | 100.0 /100 | #9 | Exceptional 13.1% |
| Burmese | 100.0 /100 | #10 | Exceptional 13.2% |
| Immigrants | Korea | 100.0 /100 | #11 | Exceptional 13.2% |
| Immigrants | South Central Asia | 100.0 /100 | #12 | Exceptional 13.3% |
| Bhutanese | 100.0 /100 | #13 | Exceptional 13.4% |
| Okinawans | 100.0 /100 | #14 | Exceptional 13.4% |
| Indians (Asian) | 100.0 /100 | #15 | Exceptional 13.4% |
| Immigrants | Eastern Asia | 100.0 /100 | #16 | Exceptional 13.5% |
| Assyrians/Chaldeans/Syriacs | 100.0 /100 | #17 | Exceptional 13.6% |
| Immigrants | China | 100.0 /100 | #18 | Exceptional 13.6% |
| Immigrants | Ireland | 100.0 /100 | #19 | Exceptional 13.7% |
| Immigrants | Japan | 100.0 /100 | #20 | Exceptional 13.8% |
| Bolivians | 100.0 /100 | #21 | Exceptional 13.8% |
Demographics Similar to Immigrants from Ethiopia by Child Poverty Under the Age of 5
In terms of child poverty under the age of 5, the demographic groups most similar to Immigrants from Ethiopia are Israeli (16.6%, a difference of 0.020%), Ethiopian (16.5%, a difference of 0.11%), Samoan (16.5%, a difference of 0.17%), Portuguese (16.5%, a difference of 0.18%), and Immigrants from Western Europe (16.5%, a difference of 0.22%).
| Demographics | Rating | Rank | Child Poverty Under the Age of 5 |
| Germans | 84.8 /100 | #138 | Excellent 16.5% |
| Immigrants | Hungary | 84.5 /100 | #139 | Excellent 16.5% |
| Guamanians/Chamorros | 84.2 /100 | #140 | Excellent 16.5% |
| Immigrants | Western Europe | 83.3 /100 | #141 | Excellent 16.5% |
| Portuguese | 83.0 /100 | #142 | Excellent 16.5% |
| Samoans | 83.0 /100 | #143 | Excellent 16.5% |
| Ethiopians | 82.7 /100 | #144 | Excellent 16.5% |
| Immigrants | Ethiopia | 82.1 /100 | #145 | Excellent 16.6% |
| Israelis | 82.0 /100 | #146 | Excellent 16.6% |
| Immigrants | Nepal | 80.3 /100 | #147 | Excellent 16.6% |
| Syrians | 79.1 /100 | #148 | Good 16.6% |
| New Zealanders | 78.7 /100 | #149 | Good 16.6% |
| Colombians | 77.8 /100 | #150 | Good 16.7% |
| Canadians | 77.6 /100 | #151 | Good 16.7% |
| Belgians | 77.2 /100 | #152 | Good 16.7% |