Okinawan vs Cree Single Mother Poverty
COMPARE
Okinawan
Cree
Single Mother Poverty
Single Mother Poverty Comparison
Okinawans
Cree
26.6%
SINGLE MOTHER POVERTY
99.9/ 100
METRIC RATING
36th/ 347
METRIC RANK
32.2%
SINGLE MOTHER POVERTY
0.0/ 100
METRIC RATING
281st/ 347
METRIC RANK
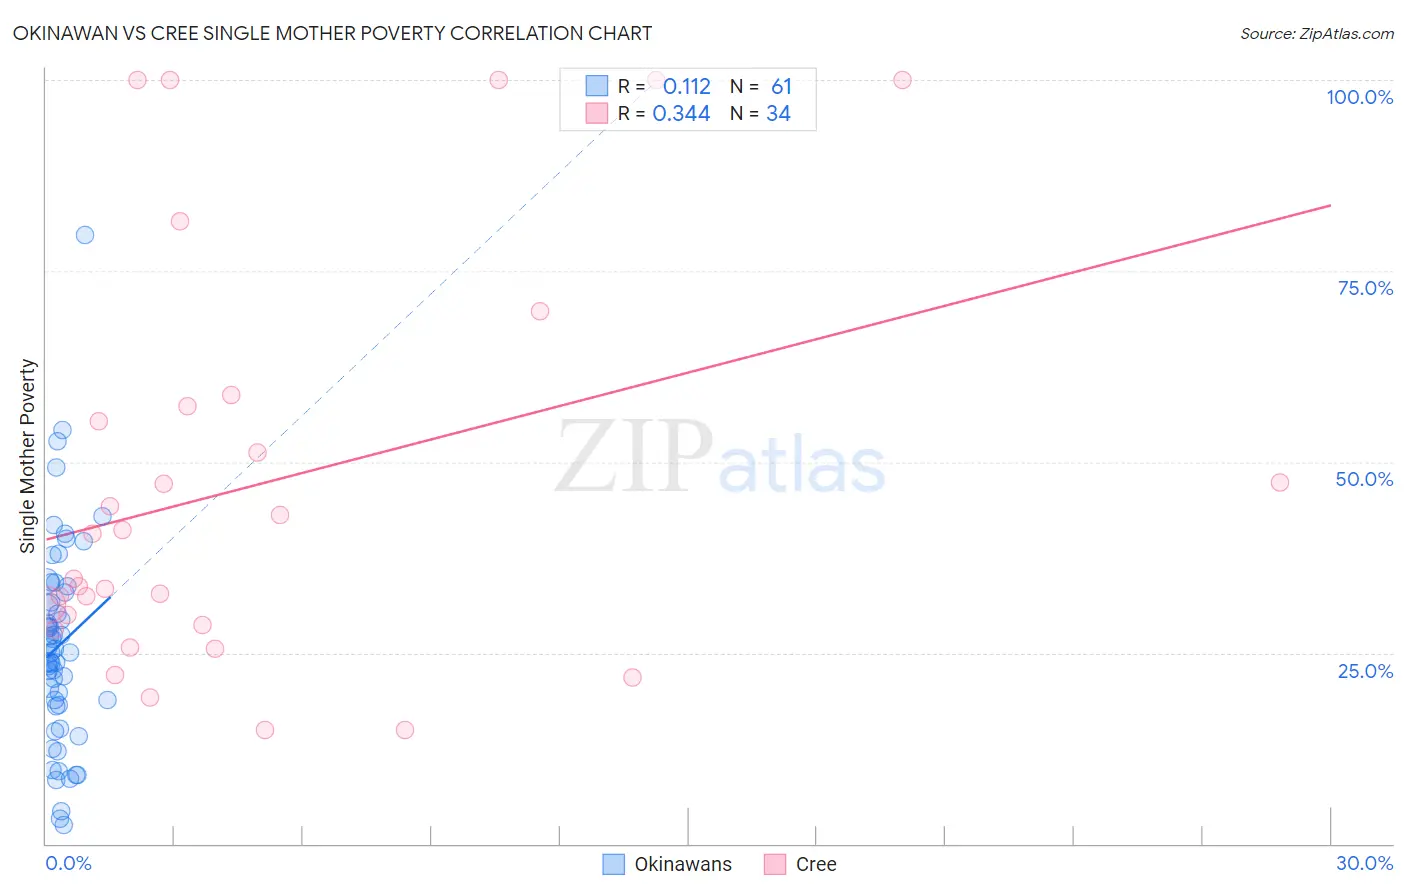
Okinawan vs Cree Single Mother Poverty Correlation Chart
The statistical analysis conducted on geographies consisting of 73,055,809 people shows a poor positive correlation between the proportion of Okinawans and poverty level among single mothers in the United States with a correlation coefficient (R) of 0.112 and weighted average of 26.6%. Similarly, the statistical analysis conducted on geographies consisting of 75,775,779 people shows a mild positive correlation between the proportion of Cree and poverty level among single mothers in the United States with a correlation coefficient (R) of 0.344 and weighted average of 32.2%, a difference of 21.0%.
Single Mother Poverty Correlation Summary
| Measurement | Okinawan | Cree |
| Minimum | 2.5% | 14.9% |
| Maximum | 79.7% | 100.0% |
| Range | 77.3% | 85.1% |
| Mean | 26.0% | 47.0% |
| Median | 25.0% | 37.6% |
| Interquartile 25% (IQ1) | 18.1% | 28.6% |
| Interquartile 75% (IQ3) | 33.4% | 57.4% |
| Interquartile Range (IQR) | 15.3% | 28.8% |
| Standard Deviation (Sample) | 13.7% | 26.7% |
| Standard Deviation (Population) | 13.6% | 26.3% |
Similar Demographics by Single Mother Poverty
Demographics Similar to Okinawans by Single Mother Poverty
In terms of single mother poverty, the demographic groups most similar to Okinawans are Immigrants from Israel (26.6%, a difference of 0.0%), Immigrants from Fiji (26.6%, a difference of 0.040%), Maltese (26.6%, a difference of 0.050%), Immigrants from Indonesia (26.6%, a difference of 0.17%), and Bulgarian (26.5%, a difference of 0.18%).
| Demographics | Rating | Rank | Single Mother Poverty |
| Jordanians | 100.0 /100 | #29 | Exceptional 26.4% |
| Turks | 100.0 /100 | #30 | Exceptional 26.4% |
| Immigrants | Philippines | 100.0 /100 | #31 | Exceptional 26.5% |
| Tongans | 99.9 /100 | #32 | Exceptional 26.5% |
| Bulgarians | 99.9 /100 | #33 | Exceptional 26.5% |
| Immigrants | Indonesia | 99.9 /100 | #34 | Exceptional 26.6% |
| Maltese | 99.9 /100 | #35 | Exceptional 26.6% |
| Okinawans | 99.9 /100 | #36 | Exceptional 26.6% |
| Immigrants | Israel | 99.9 /100 | #37 | Exceptional 26.6% |
| Immigrants | Fiji | 99.9 /100 | #38 | Exceptional 26.6% |
| Sri Lankans | 99.9 /100 | #39 | Exceptional 26.7% |
| Immigrants | Vietnam | 99.9 /100 | #40 | Exceptional 26.7% |
| Immigrants | Greece | 99.9 /100 | #41 | Exceptional 26.7% |
| Armenians | 99.9 /100 | #42 | Exceptional 26.8% |
| Tsimshian | 99.9 /100 | #43 | Exceptional 26.8% |
Demographics Similar to Cree by Single Mother Poverty
In terms of single mother poverty, the demographic groups most similar to Cree are Nonimmigrants (32.2%, a difference of 0.030%), Immigrants from the Azores (32.2%, a difference of 0.11%), Marshallese (32.1%, a difference of 0.24%), Spanish American (32.3%, a difference of 0.36%), and Immigrants from Zaire (32.0%, a difference of 0.64%).
| Demographics | Rating | Rank | Single Mother Poverty |
| Bangladeshis | 0.1 /100 | #274 | Tragic 31.7% |
| Central Americans | 0.1 /100 | #275 | Tragic 31.8% |
| Delaware | 0.0 /100 | #276 | Tragic 31.8% |
| Mexican American Indians | 0.0 /100 | #277 | Tragic 31.9% |
| Immigrants | Zaire | 0.0 /100 | #278 | Tragic 32.0% |
| Marshallese | 0.0 /100 | #279 | Tragic 32.1% |
| Immigrants | Nonimmigrants | 0.0 /100 | #280 | Tragic 32.2% |
| Cree | 0.0 /100 | #281 | Tragic 32.2% |
| Immigrants | Azores | 0.0 /100 | #282 | Tragic 32.2% |
| Spanish Americans | 0.0 /100 | #283 | Tragic 32.3% |
| Indonesians | 0.0 /100 | #284 | Tragic 32.4% |
| Immigrants | Latin America | 0.0 /100 | #285 | Tragic 32.4% |
| Yup'ik | 0.0 /100 | #286 | Tragic 32.5% |
| Immigrants | Dominica | 0.0 /100 | #287 | Tragic 32.5% |
| Somalis | 0.0 /100 | #288 | Tragic 32.6% |