Norwegian vs Somali Female Poverty Among 18-24 Year Olds
COMPARE
Norwegian
Somali
Female Poverty Among 18-24 Year Olds
Female Poverty Among 18-24 Year Olds Comparison
Norwegians
Somalis
20.7%
FEMALE POVERTY AMONG 18-24 YEAR OLDS
7.3/ 100
METRIC RATING
225th/ 347
METRIC RANK
25.1%
FEMALE POVERTY AMONG 18-24 YEAR OLDS
0.0/ 100
METRIC RATING
322nd/ 347
METRIC RANK
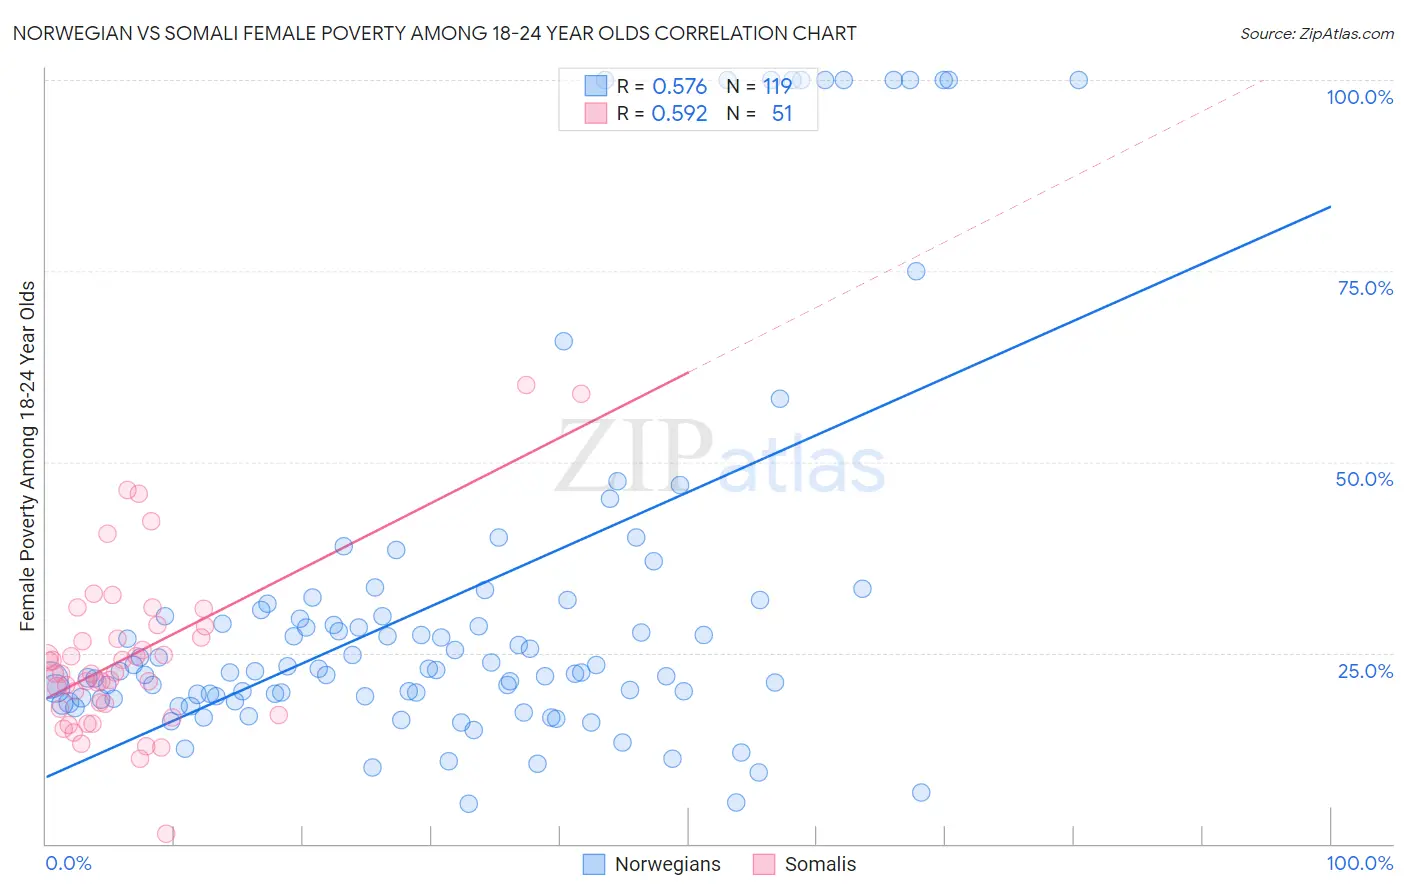
Norwegian vs Somali Female Poverty Among 18-24 Year Olds Correlation Chart
The statistical analysis conducted on geographies consisting of 505,664,525 people shows a substantial positive correlation between the proportion of Norwegians and poverty level among females between the ages 18 and 24 in the United States with a correlation coefficient (R) of 0.576 and weighted average of 20.7%. Similarly, the statistical analysis conducted on geographies consisting of 98,981,198 people shows a substantial positive correlation between the proportion of Somalis and poverty level among females between the ages 18 and 24 in the United States with a correlation coefficient (R) of 0.592 and weighted average of 25.1%, a difference of 21.3%.
Female Poverty Among 18-24 Year Olds Correlation Summary
| Measurement | Norwegian | Somali |
| Minimum | 5.2% | 1.4% |
| Maximum | 100.0% | 60.0% |
| Range | 94.8% | 58.6% |
| Mean | 31.9% | 24.7% |
| Median | 22.7% | 22.3% |
| Interquartile 25% (IQ1) | 19.1% | 17.7% |
| Interquartile 75% (IQ3) | 31.5% | 28.4% |
| Interquartile Range (IQR) | 12.4% | 10.7% |
| Standard Deviation (Sample) | 25.1% | 11.1% |
| Standard Deviation (Population) | 25.0% | 11.0% |
Similar Demographics by Female Poverty Among 18-24 Year Olds
Demographics Similar to Norwegians by Female Poverty Among 18-24 Year Olds
In terms of female poverty among 18-24 year olds, the demographic groups most similar to Norwegians are Estonian (20.7%, a difference of 0.020%), Immigrants from Liberia (20.7%, a difference of 0.060%), Immigrants from Sweden (20.7%, a difference of 0.080%), French (20.7%, a difference of 0.11%), and Guatemalan (20.7%, a difference of 0.13%).
| Demographics | Rating | Rank | Female Poverty Among 18-24 Year Olds |
| Immigrants | Nepal | 9.6 /100 | #218 | Tragic 20.7% |
| Immigrants | Micronesia | 9.6 /100 | #219 | Tragic 20.7% |
| British | 9.4 /100 | #220 | Tragic 20.7% |
| Barbadians | 9.0 /100 | #221 | Tragic 20.7% |
| Guatemalans | 8.1 /100 | #222 | Tragic 20.7% |
| French | 7.9 /100 | #223 | Tragic 20.7% |
| Immigrants | Liberia | 7.6 /100 | #224 | Tragic 20.7% |
| Norwegians | 7.3 /100 | #225 | Tragic 20.7% |
| Estonians | 7.2 /100 | #226 | Tragic 20.7% |
| Immigrants | Sweden | 6.8 /100 | #227 | Tragic 20.7% |
| Ghanaians | 6.5 /100 | #228 | Tragic 20.8% |
| Australians | 6.1 /100 | #229 | Tragic 20.8% |
| Whites/Caucasians | 6.1 /100 | #230 | Tragic 20.8% |
| Immigrants | St. Vincent and the Grenadines | 6.0 /100 | #231 | Tragic 20.8% |
| Finns | 6.0 /100 | #232 | Tragic 20.8% |
Demographics Similar to Somalis by Female Poverty Among 18-24 Year Olds
In terms of female poverty among 18-24 year olds, the demographic groups most similar to Somalis are Arapaho (25.2%, a difference of 0.070%), German Russian (25.2%, a difference of 0.10%), Immigrants from Zaire (25.1%, a difference of 0.30%), Immigrants from Saudi Arabia (25.3%, a difference of 0.53%), and Yakama (25.3%, a difference of 0.78%).
| Demographics | Rating | Rank | Female Poverty Among 18-24 Year Olds |
| Blacks/African Americans | 0.0 /100 | #315 | Tragic 24.3% |
| Alsatians | 0.0 /100 | #316 | Tragic 24.4% |
| Osage | 0.0 /100 | #317 | Tragic 24.5% |
| Chickasaw | 0.0 /100 | #318 | Tragic 24.5% |
| Dutch West Indians | 0.0 /100 | #319 | Tragic 24.5% |
| Immigrants | Congo | 0.0 /100 | #320 | Tragic 24.6% |
| Immigrants | Zaire | 0.0 /100 | #321 | Tragic 25.1% |
| Somalis | 0.0 /100 | #322 | Tragic 25.1% |
| Arapaho | 0.0 /100 | #323 | Tragic 25.2% |
| German Russians | 0.0 /100 | #324 | Tragic 25.2% |
| Immigrants | Saudi Arabia | 0.0 /100 | #325 | Tragic 25.3% |
| Yakama | 0.0 /100 | #326 | Tragic 25.3% |
| Ute | 0.0 /100 | #327 | Tragic 25.4% |
| Natives/Alaskans | 0.0 /100 | #328 | Tragic 25.4% |
| Cajuns | 0.0 /100 | #329 | Tragic 25.7% |